


Fed Hits Kill Switch On Market Liquidity
Stock-Markets / Financial Markets 2012 Aug 04, 2012 - 07:17 AM GMTBy: Clif_Droke

 Lately investors have been worried about liquidity, specifically the central bank's willingness (or unwillingness) to continue providing it, and with good reason. Without periodic injections of liquidity, investors eventually lose interest as financial markets begin to languish. And in a financial economy like the U.S., the death of a bull market means the death of the economic recovery.
Bull markets are to a large extent liquidity driven affairs. Without an abundance of excess monetary liquidity sloshing through the financial market, stocks and commodities have little hope of developing the necessary ingredient of forward momentum. Momentum is what attracts an ever-growing number of investors to participate in a bull market, which in turn is what keeps the bull market going. When liquidity dries up, momentum perishes and investors quickly lose interest. This, in a nutshell, is how bull markets turn into bear markets, viz. the absence of liquidity.
This week has seen two significant central bank meetings: the FOMC met on Wednesday while the ECB met today to discuss monetary policy. Both the U.S. and European central banks disappointed investors who expected the banks to show their willingness to provide more monetary stimulus.
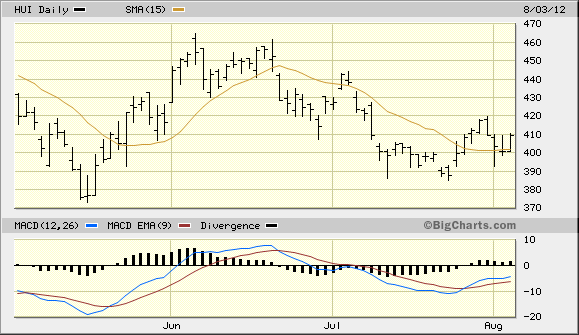
The Dow Jones Industrial Average reacted to this disappointment by falling some 200 points (intraday) over the course of the last two days. The NYSE Broker/Dealer Index (XBD), which is much more sensitive to future liquidity expectations, plummeted 9% since Wednesday's Fed meeting. The gold and silver stocks were also subject to the widespread investor disappointment and were down both Wednesday and Thursday. Although the damage has so far been fairly limited within the PM stock group, volatility among individual mining shares has been increasing since the central bank meetings (see HUI chart below).
Bull markets typically begin with a massive dose of liquidity, just as they end whenever the liquidity stream dries up. The reason why an increasing number of market participants have been agitating for the world's leading central banks to amp up the liquidity is obvious: the U.S.-led global financial market recovery that began in 2009 appears to be slowly winding down according to a number of monetary indicators.
One indication of how much liquidity has diminished in just the last few months can be seen in the following chart. The following graph shows the Treasury yield curve, which is calculated by dividing the 10-year Treasury yield into the 3-month T-bill. On a very basic level tells you gross profit margins of financial institutions. They borrow short-term money and loan it out at long-term yields. A rising yield curve - especially when above the 1% level - is generally regarded as bullish for the financial market and economic outlook.
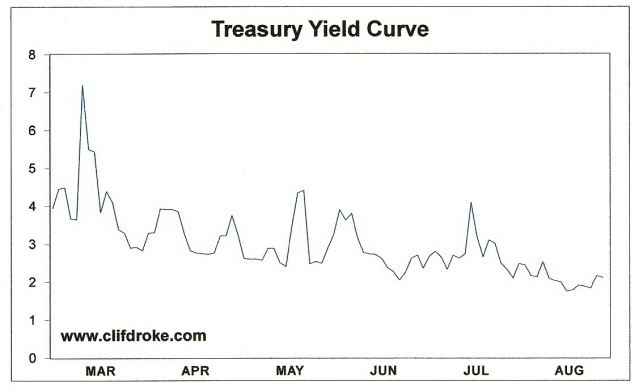
Since the first and second quantitative easing (QE1 and QE2) programs of recent years the yield curve has been well above 1%. But in recent months the yield curve has been falling, as you can see here. The indicator is still reflective of an overall healthy monetary trend, but the falling nature of the Treasury curve may suggest to the Fed that it was high time for the Fed to give the market some sort of boost in the short term...even if that "boost" was nothing more than the promise of further stimulus down the road. The Fed's latest failure to do so is another reason why investors are understandably concerned about the tenacity of the recovery and are questioning how much longer it can last without central bank intervention.
The leaders of both the Fed and the ECB threw out statements to the effect that they may intervene before the end of this year, such an intervention isn't likely. Fed chief Bernanke, like his predecessor, relies on the stock market as a barometer to tell him when intervention is seasonable. Barring an unforeseen market collapse by the end of this year, another round of QE is unlikely in 2012.
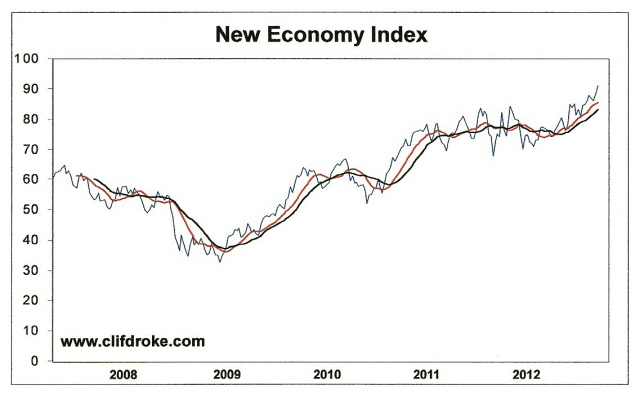
Aside from the overall strength projected by the major stock market indices, another important indicator is giving Bernanke some assurance that he is okay to hold off on intervening. The New Economy Index (NEI), which reflects the market performance of the leading U.S. consumer and business companies, is at a new all-time high as of this writing. This chart presents the picture of a bullish consumer retail economic picture, one that Bernanke is surely watching. The last time the Fed intervened with QE2, the NEI had preceded this by giving a "sell" signal. No such sell signal has been made in the New Economy Index since 2010.
While it's true that the consumer retail economy is still in good shape, it is a mistake to use surface measures of near-term economic strength like corporate profits and retail sales to guide policy decisions. Undercurrents of deflation can still be seen bubbling to the surface from time to time; moreover, the danger of an economic conflagration in Europe - and the possibility of it spreading to the U.S. - are reasons the Fed should relax its monetary policy stance. Unfortunately, there is every reason for believing the Fed will once again fall asleep at the wheel just as it did in the 2-3 years leading up to the 2008 credit crisis.
The Fed isn't solely to be blamed here. It is a truism of history that both governments and central banks have an inveterate tendency to underestimate the amount of monetary and fiscal stimulus needed to resuscitate a flagging economy. Worse, governments often make the wrong policy choices during the most critical times of an economic crisis. Paul Johnson, in his 1991 book Modern Times, made some insightful observations about the economic policies of the Great Depression. He noted for instance,
"...the 1932 Revenue Act saw the greatest taxation increase in U.S. history in peacetime, with the rate on high incomes jumping from a quarter to 63 percent. This made nonsense of [President] Hoover's earlier tax cuts but by now Hoover had lost control of Congress and was not in a position to pursue a coherent fiscal policy."
Sadly, history has a perverse way of repeating itself and if that observation holds true we can expect to see additional tax increases (in various forms) in the coming years as governments try to deal with the problem of deflation.
Although QE1 and QE2 had a discernible impact in lifting equity and commodity prices in the years since the 2008 credit crisis, the Fed's decision to hold off on any further liquidity increases will sooner or later feed into the deflationary undercurrents within the global economy. The reluctance of banks and governments to provide additional stimulus - whether in the form of monetary easing, lower taxes and regulatory easing - will contribute to the downward velocity of the declining long-wave cycle in the next couple of years. Gold, as the ultimate safe haven at both ends of the long-wave, will eventually prove its merit as a store of value in deflation. Before we arrive at that critical juncture, however, there will undoubtedly be phases of volatility along the way that temporarily obstruct gold's forward progress - just as we've seen since last September.
Although it may seem premature to assert that the Fed has hit the proverbial "kill switch" on liquidity, in the context of the long-wave deflation we're in this isn't an exaggeration. By not maintaining an ample supply of liquidity, the Fed has effectively numbered the days of the recovery. Whatever gains the market makes from here will come primarily from a combination of investor psychology, the peaking 4-year cycle plus the residual momentum from the 2009-2012 bull market between now and early 2013 (when the final "hard down" phase of the 60-year cycle begins).
2014: America's Date With Destiny
Take a journey into the future with me as we discover what the future may unfold in the fateful period leading up to - and following - the 120-year cycle bottom in late 2014.
Picking up where I left off in my previous work, The Stock Market Cycles, I expand on the Kress cycle narrative and explain how the 120-year Mega cycle influences the market, the economy and other aspects of American life and culture. My latest book, 2014: America's Date With Destiny, examines the most vital issues facing America and the global economy in the 2-3 years ahead.
The new book explains that the credit crisis of 2008 was merely the prelude in an intensifying global credit storm. If the basis for my prediction continue true to form - namely the long-term Kress cycles - the worst part of the crisis lies ahead in the years 2013-2014. The book is now available for sale at: http://www.clifdroke.com/books/destiny.html
Order today to receive your autographed copy and a FREE 1-month trial subscription to the Gold & Silver Stock Report newsletter. Published twice each week, the newsletter uses the method described in this book for making profitable trades among the actively traded gold mining shares.
By Clif Droke
www.clifdroke.com
Clif Droke is the editor of the daily Gold & Silver Stock Report. Published daily since 2002, the report provides forecasts and analysis of the leading gold, silver, uranium and energy stocks from a short-term technical standpoint. He is also the author of numerous books, including 'How to Read Chart Patterns for Greater Profits.' For more information visit www.clifdroke.com
© 2005-2022 http://www.MarketOracle.co.uk - The Market Oracle is a FREE Daily Financial Markets Analysis & Forecasting online publication.