


Food Stamp America, Poverty’s Roll Call
Politics / US Politics Sep 21, 2012 - 08:00 AM GMTBy: Richard_Mills

 Increases in taxes and, to a lesser extent, reductions in spending, the infamous $600 billion “Fiscal Cliff” that’s looming in the new year, will reduce the US federal budget deficit by 4 - 5.1 percent of Gross Domestic Product (GDP).
But at what cost?
The US Congressional Budget Office (CBO) analyzed two different scenarios if the fiscal cliff was left in place:
- As measured by Fiscal Year - the combination of policies under current law will reduce the federal budget deficit by $607 billion, or 4.0 percent of gross domestic product (GDP), between fiscal years 2012 and 2013. The resulting weakening of the economy will lower taxable incomes and raise unemployment, generating a reduction in tax revenues and an increase in spending on such items as unemployment insurance. With that economic feedback incorporated, the deficit will drop by $560 billion between fiscal years 2012 and 2013.
- If measured for calendar years 2012 and 2013, the amount of fiscal restraint is even larger. Most of the policy changes that reduce the deficit are scheduled to take effect at the beginning of calendar year 2013, so budget figures for fiscal year 2013—which begins in October 2012—reflect only about three-quarters of the effects of those policies on an annual basis. According to CBO’s estimates, the tax and spending policies that will be in effect under current law will reduce the federal budget deficit by 5.1 percent of GDP between calendar years 2012 and 2013 (with the resulting economic feedback included, the reduction will be smaller).
Under those fiscal conditions, which will occur under current law, growth in real (inflation-adjusted) GDP in calendar year 2013 will be just 0.5 percent, CBO expects—with the economy projected to contract at an annual rate of 1.3 percent in the first half of the year and expand at an annual rate of 2.3 percent in the second half. Given the pattern of past recessions as identified by the National Bureau of Economic Research, such a contraction in output in the first half of 2013 would probably be judged to be a recession.
According to the CBO if the fiscal cliff was removed, growth of real GDP in calendar year 2013 would be around 4.4 percent.
The ranks of the working-age poor are at the 1960s levels that led to the national war on poverty.
You get food assistance when you are barely scraping out a living. There are over 46,000,000 million Americans currently receiving food assistance – that’s one out of every seven people. There are more Americans on food stamps, using 2011 data, than the entire populations of Florida, Illinois, Nevada and Michigan.
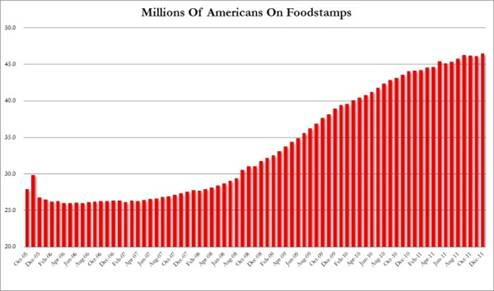
Source: Zero Hedge, SNAP
The 2011 poverty rate (the US Census Bureau’s poverty level threshold is $23,000 for a household of four and the rate of poverty has been rising since just before the year 2000) in the US was 15 percent - 46.2 million Americans.
Poverty Blues
“If politicians told the truth If mail got delivered on time If you never lost your keys If the children never whined If every day was a sleep-in day And we always felt full and fine The poor would still be with us An' we'd still clear 'em from our mind” grrrrecords.com
The Federal Deposit Insurance Corp. (FDIC) reported more than a quarter of American households lacks access to full banking services or have no bank account while nearly 10 million U.S. households have no checking or savings accounts. The survey (the second of its kind) said 821,000 more U.S. households have no bank accounts since the agency conducted its first survey in 2009.
According to the Federal Reserve's Survey of Consumer Finances, from 2007 to 2010, a typical US family lost 39 percent of its wealth - in 2007, the median family net worth was $126,400, in 2010, it was $77,300.
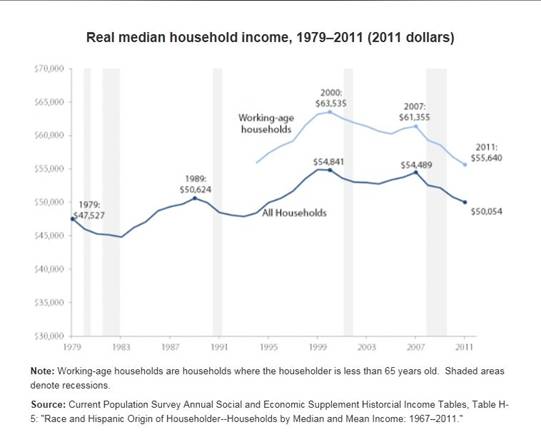
From 2000 to 2011, median income for working-age households fell from $63,535 to $55,640, a decline of $7,895, or 12.4 percent.
Median household income declined by 1.5 percent to $50,054 in 2011 from $50,831 in 2010. Median income in 2011 was down almost nine percent from the recent peak in 1999.
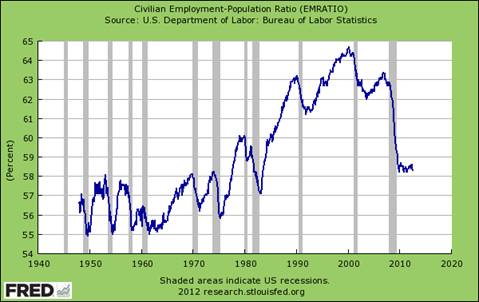
Our overall workforce participation rate looks dismal.
Poverty
“Up every morning with the sun I work all day 'til the evening comes Busters and corns all in my hands Lord, have mercy on a working man I guess I'm gonna die, just like I live in poverty Oh Lord, it's so hard” Bobby Blue Band
The 2011 Census report also showed that income inequality increased in 2011. The Gini index, a measure of household income inequality, increased 1.6 percent in 2011, its first annual increase since 1993.
While the vast majority of Americans were watching their wealth slip away, the fortunes of their representatives in Washington, and America’s super rich, has grown by leaps and bounds.
The average net worth of the 400 wealthiest Americans, classified as the super rich, rose to an all-time record of $4.2 billion, up more than 13 percent from a year ago. Collectively, this group's net worth, currently at $1.7 trillion, is the equivalent of one-eighth of the entire U.S. economy. A full one quarter of these super rich Americans come from the finance and investment sectors.
"I'm not concerned about the very poor - we have a safety net there." GOP presidential nominee Mitt Romney
In Congress being a millionaire just makes you average.
Consider:
- According to the Center for Responsive Politics (CRP), a Washington watchdog, nearly half of the members of Congress are millionaires
- In 2010 the median net worth of a U.S. senator was $2.63 million, up 11 percent from the year before
- The median estimated net worth for House members was $756,765 and the median net worth of House members almost tripled from 1984 and 2009
- Unemployment insurance kept 2.3 million people from being counted as living below the poverty line in 2011. Social Security kept another 21.4 million people off poverty’s roll call. The Supplemental Nutrition Assistance Program (SNAP) kept 3.9 million people out of poverty, the Earned Income Tax Credit kept 5.7 million people out of poverty.
- In 2011, the poverty rate for children was 22 percent, 14 percent for those between 18 and 64, and 9 percent for those at least 65
“Austerity will increase poverty both through cuts in programs, like unemployment insurance extensions, and through job loss.” Heidi Shierholz, economist, Economic Policy Institute
Looming across-the-board budget cuts, as part of a larger effort to rein in the federal budget deficit, will shrink safety net programs, such as food stamps and welfare and increase unemployment and poverty levels.
We’re going to increase the misery, we’re going to add millions to poverty’s roll call for:
- Growth in real (inflation-adjusted) GDP in calendar year 2013 of 0.5 percent
- An economy projected to contract at an annual rate of 1.3 percent in the first half of 2013
- A recession
“The labor market is the core building block of family incomes—persistent high unemployment means family incomes drop and poverty rates remain high.” Already More Than A Lost Decade, Heidi Shierholz and Elise Gould
Conclusion
In a recent article, “A Nations Report Card” I said several things needed to happen to put people back to work and restore confidence, a few are happening. The Federal Reserve is being more open about its policies and intentions and has recently started QE3. More needs to be done. “The “fiscal cliff,” the $600 billion in budget cuts and tax increases, must be eliminated by the US government and an infrastructure maintenance and build out program put in place.
"It seems to me there are very dangerous ambiguities about our democracy in its actual present condition. I wonder to what extent our ideals are now a front for organized selfishness and irresponsibility. If our affluent society ever breaks down and the facade is taken away, what are we going to have left?" Thomas Merton
Fiscal policy needs to be re-visited, growth of real GDP in calendar year 2013 of 4.4 percent, versus .05 percent, and politicians working together to better Americans lives by providing jobs instead of enriching themselves and their banker friends needs to be on our radar screens. Is all this on yours?
If not, maybe they should be.
By Richard (Rick) Mills
If you're interested in learning more about the junior resource and bio-med sectors please come and visit us at www.aheadoftheherd.com
Site membership is free. No credit card or personal information is asked for.
Richard is host of Aheadoftheherd.com and invests in the junior resource sector.
His articles have been published on over 400 websites, including:
Wall Street Journal, Market Oracle, SafeHaven , USAToday, National Post, Stockhouse, Lewrockwell, Pinnacledigest, Uranium Miner, Beforeitsnews, SeekingAlpha, MontrealGazette, Casey Research, 24hgold, Vancouver Sun, CBSnews, SilverBearCafe, Infomine, Huffington Post, Mineweb, 321Gold, Kitco, Gold-Eagle, The Gold/Energy Reports, Calgary Herald, Resource Investor, Mining.com, Forbes, FNArena, Uraniumseek, Financial Sense, Goldseek, Dallasnews, Vantagewire, Resourceclips and the Association of Mining Analysts.
Copyright © 2012 Richard (Rick) Mills - All Rights Reserved
Legal Notice / Disclaimer: This document is not and should not be construed as an offer to sell or the solicitation of an offer to purchase or subscribe for any investment. Richard Mills has based this document on information obtained from sources he believes to be reliable but which has not been independently verified; Richard Mills makes no guarantee, representation or warranty and accepts no responsibility or liability as to its accuracy or completeness. Expressions of opinion are those of Richard Mills only and are subject to change without notice. Richard Mills assumes no warranty, liability or guarantee for the current relevance, correctness or completeness of any information provided within this Report and will not be held liable for the consequence of reliance upon any opinion or statement contained herein or any omission. Furthermore, I, Richard Mills, assume no liability for any direct or indirect loss or damage or, in particular, for lost profit, which you may incur as a result of the use and existence of the information provided within this Report.
© 2005-2022 http://www.MarketOracle.co.uk - The Market Oracle is a FREE Daily Financial Markets Analysis & Forecasting online publication.