Gold And Silver – Follow What The Market Says, Not What Others Say About The Market
Commodities / Gold and Silver Stocks 2013 Jan 14, 2013 - 02:15 AM GMTBy: Michael_Noonan
 The article title is a wise message from a voice in the past. The best way to follow
what the market says is to read its net effect as derived from the collective of all
market participants that have made a buy or sell commitment. If it does not show
up in the chart, then what is being expressed is an opinion about the market.
When one takes this approach, letting the market lead, there is no need to wonder
what to do next. Present tense developing market activity, combined with a fixed set
of trading rules is all that is needed. It is then a relatively simple matter of viewing a
market from different time frames to see what is being “said.” We like to start with a
monthly to know what the prevailing forces are doing because higher time frames tell
what “smart money” is doing.
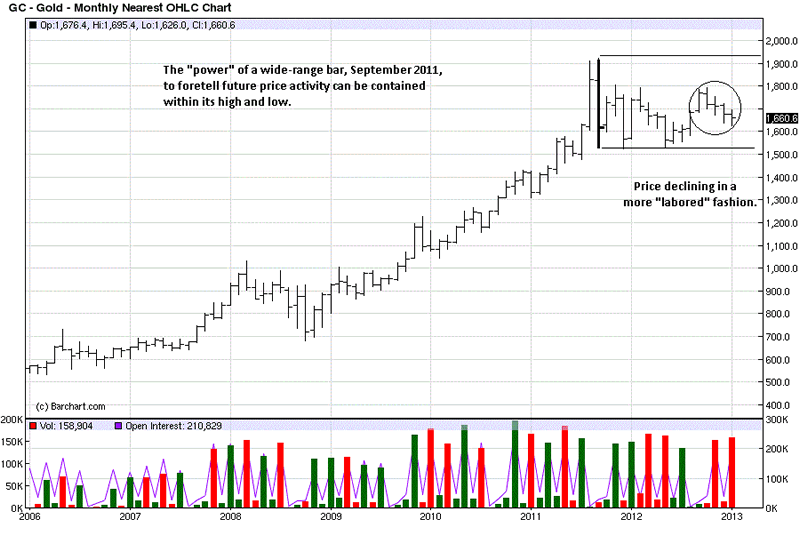
Whenever you see an unusually wide range bar, pay attention for it can be making an
important statement. Very often, a wide range bar will lead to a trading range, bound
by the high and low of the bar. We see that has been the case in gold for the past 16
months. The unanswered question is, are we seeing distribution that will lead to lower
prices, or is this re-accumulation in preparation to go higher?
The answer to that question will come from reading clues left behind by market activity.
If an answer is not apparent, and many times it is not, then more information is needed,
and it will come. This is where patience is required, not trying to anticipate what may
happen, but wait for clearer direction. The market never disappoints.
One observation is how the past four months are more of a labored decline, no wide
range bars down like we saw back in September and December of 2011. We have
commented about this before: four months down, correcting the previous two rally
bars. The market is taking twice as long to retrace past gains, without fully retracing
the entire gain.
Markets are replete with logic. In a horse race, if one horse covers ground from point
A to point B, and another horse runs the same course but takes twice as long to get
from point B not quite to point A, which horse is showing the most promise?
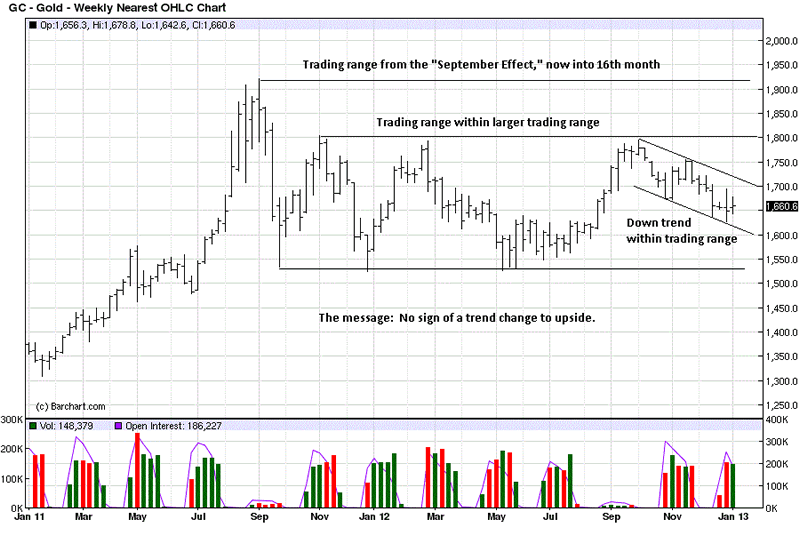
Once you see a “story” develop in the higher time frame, it is easier to then look at it from
a more detailed perspective. The weekly provides the same information but with more
focus. We learn that the market is most recently in a down trending channel within a
trading range that is also within a much larger trading range, a bit like Russian nesting
dolls.
The message is clear, and it is simple: There is no sign of a trend change that would take
price higher. Before gold can go to $2,000, $3,000 or wherever, would you not agree it
must first prove it can get above $1,800? This is not a chicken/egg dilemma. Price right
now is stuck on Marvin Gardens, not even close to “Go.”
From Monopoly we will switch to Aesop’s Fable, The Ant and The Grasshopper. In a
trading range, the grasshopper is busy chasing up and down swings, while the ant is busy
preparing for what is to follow. How to best prepare? Read the activity and see what the
market is saying.
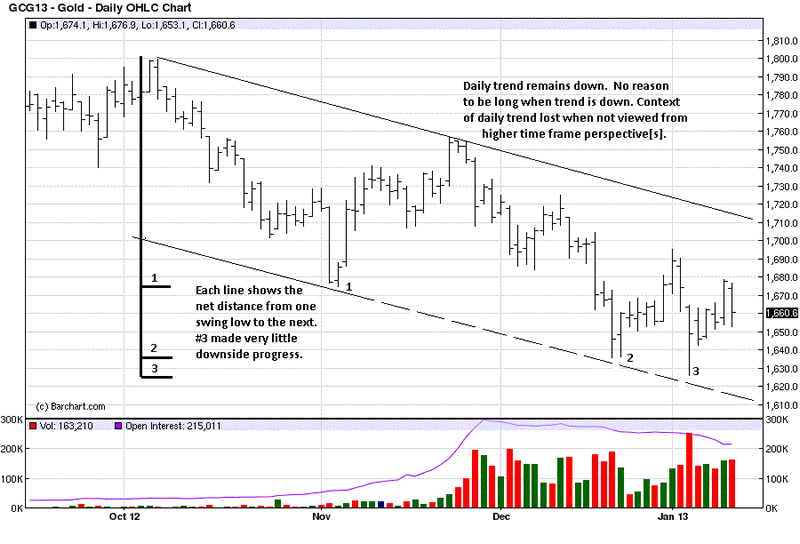
Most traders only look at daily charts and intra day time frames, a little like a blind man
trying to describe an elephant by touching a few parts of its body. [Ugh! Will these
analogies never end?! They do serve a purpose.] If you looked only at this daily chart,
you would not have as strong a sense as to how much overhead resistance there is before
a move of substance can get underway. Still, we can see early clues before they show up on the weekly and monthly charts.
The most important information we can see is how the downside thrusts are making
less progress by comparing the distance each swing low has made from the last swing
high. Here again, logic tells us if the effort expended to go lower is making less and less
progress, it is possible that sellers are running out of the ability to keep price down. We
see that at the last low, 3 on the chart.
The sharp increase in volume, and the location of the close tells us that buyers were more
in control than sellers, and price did rally from that low. The “buyers” are most likely
shorts covering, and maybe some bottom-pickers, but it is not fresh new positions that are
being established.
A point to make about the down channel: The upper line is solid, while the lower line is
partially broken. We did that so you can see how past action can often lead you to where
future action becomes important. The top line is drawn across the swing highs of October
and November. The lower channel line is created parallel to the upper channel line, using
the swing low between the October/November highs as the anchor, and extending the line
parallel, into the future.
If you were to cover up the market activity to the right of the November high, and see how
the line from the November swing low is extended into the future into January, and then
uncover the price action since the November high, the broken line was established before
price activity lows of December and January. The bottom channel line represents an
oversold market condition. What is key is to observe how price responds to it.
The reaction at 3 was relatively strong. Now, we get to watch how future market activity
develops within these chart contexts. The HOW of developing activity will tell us what
to expect, moving forward. For right now, the market is not sending any clear signal that
the current trading range is over. None.
As always, for buyers of physical gold, the timing is now, at any price.
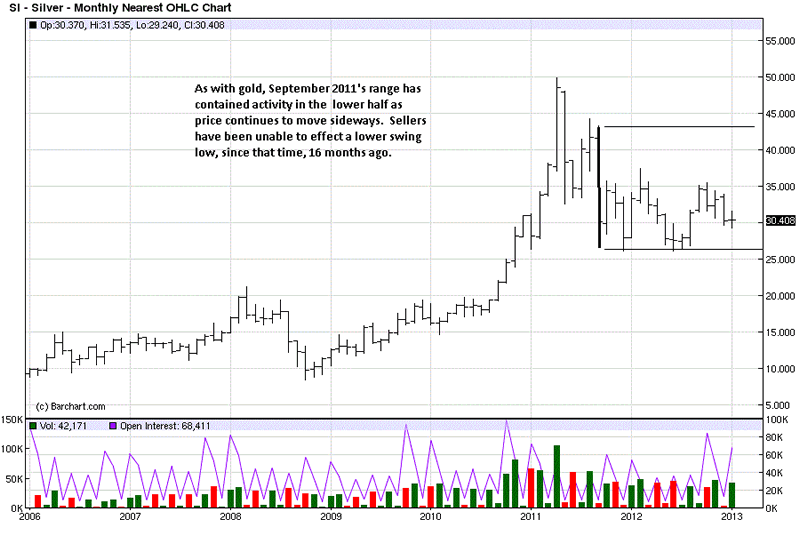
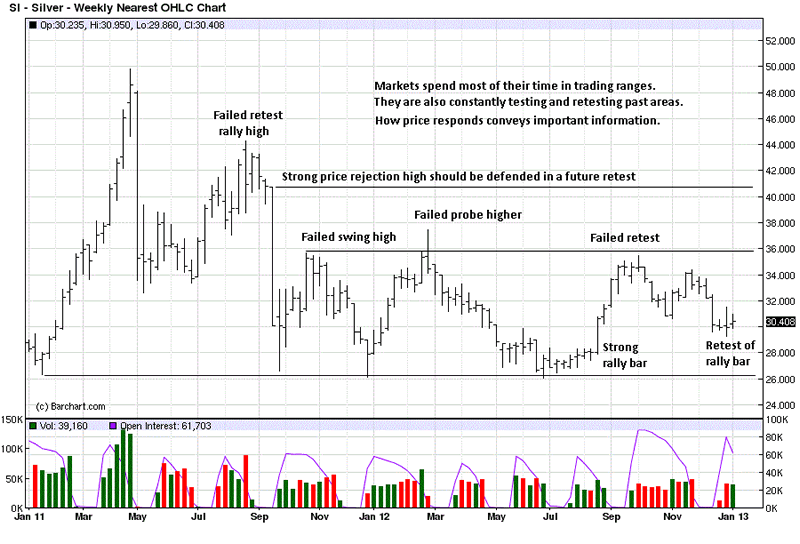
We see a similar situation in silver, but from a slightly weaker condition. The one plus
to offer is the fact that over the last 16 months, sellers have not been able to establish
any important lower swing low.
We already know silver and gold are locked in a trading range. Still, gathering information
will help make a determination of what to do and, as importantly, when. Trading ranges
tell us the “when” is not now. [TR = Trading Range].
What to do is answered from the trading range clues, and the start is that the TR began
in a declining market. The failed retest rally high, August 2011, led to a strong move
lower in September, the wide range bar down. At some point in the future, that high
will be retested by buyers and defended by sellers. How price responds in the retest
will say a lot about the then market strength or weakness. A horizontal line is drawn to
show that price level at a future time.
There was a retest of that decline at the end of October 2011, and a failed probe at the
end of February 2012. Markets are continually testing and retesting important areas,
and it is critical to observe how price responds, for that is the market telling us whether
a market is strong or weak. There are three failed probes in the trading range, but there
are also three successful holds at the bottom of the trading range. We get know who will
win the battle as price moves farther along the Right Hand Side, [RHS] of the TR.
We do not yet know if the current retest of the August 2012 rally bar is significant, so we
watch it to see if price gains upside momentum, leading to a RHS breakout of the range,
or if price will retreat back and remain in the TR, or even breakout to the downside.
Here is where it is important to watch what the market says and not what others say
about the market. All the clamor for higher silver prices is ignoring what is going on in
the present tense, and it says: silver ain’t going anywhere higher, yet. Put sentiment
aside and deal with what is.
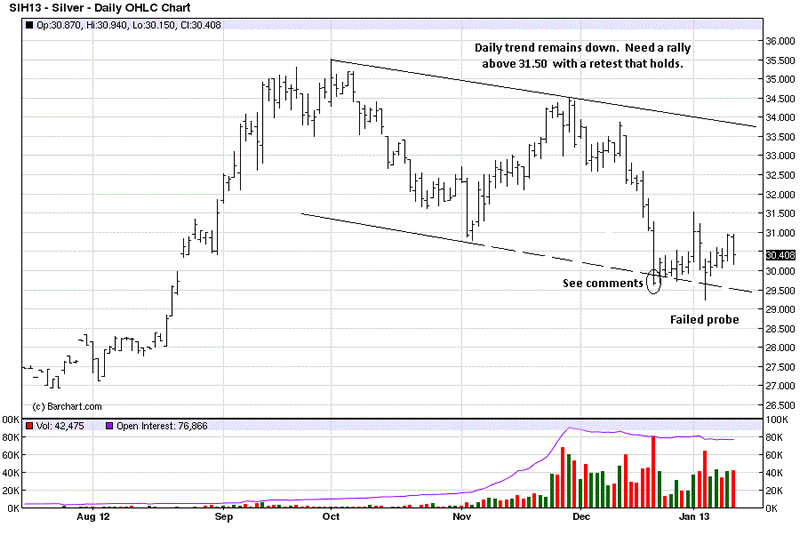
The daily picture echoes the higher time frames. The first possible glimmer of a change
in market behavior will come when price can rally above 31.50, on wide ranges, strong
closes, and increased volume, followed by a weak retest that leads to another swing high.
There you have it in a nut shell.
Last month, we commented on our website that a low-end close on a wide range bar can
sometimes lead to a change. That was pointed out in a December Commentary, [click on http://bit.ly/U285PF]. It was a follow-up to the first reference to that kind of situation,
a few days earlier, [click on http://bit.ly/YmRoVb] for some market insight. The failed
probe lower, on volume second only to the December low-end close, is a red flag for bears.
We need to see more positive developing market activity, like what was said in the above
paragraph, to determine if some kind of change may be starting.
Buy the physical, without concern. Wait on the futures. The market says so.
By Michael Noonan
Michael Noonan, mn@edgetraderplus.com, is a Chicago-based trader with over 30 years in the business. His sole approach to analysis is derived from developing market pattern behavior, found in the form of Price, Volume, and Time, and it is generated from the best source possible, the market itself.
© 2013 Copyright Michael Noonan - All Rights Reserved Disclaimer: The above is a matter of opinion provided for general information purposes only and is not intended as investment advice. Information and analysis above are derived from sources and utilising methods believed to be reliable, but we cannot accept responsibility for any losses you may incur as a result of this analysis. Individuals should consult with their personal financial advisors.
Michael Noonan Archive |
© 2005-2022 http://www.MarketOracle.co.uk - The Market Oracle is a FREE Daily Financial Markets Analysis & Forecasting online publication.


