


Silver Prices – The Big Picture
Commodities / Gold and Silver 2013 Feb 08, 2013 - 10:22 AM GMTBy: DeviantInvestor

 Question: What do May 2004, January 2005, August 2005, June 2006, October 2008, February 2010, September 2011, December 2011, June 2012, and December 2012 have in common?
Answer: They represented significant price lows in silver, AND those lows were confirmed by the weekly stochastic (14,3,3) indicator and the weekly TDI Trade Signal Line (13,5) as shown in the following chart of silver prices since 2004. Note the red circles showing price lows and corresponding turns in the stochastic and TDI indicators from oversold levels. (Information on the stochastic and TDI are here and here.)
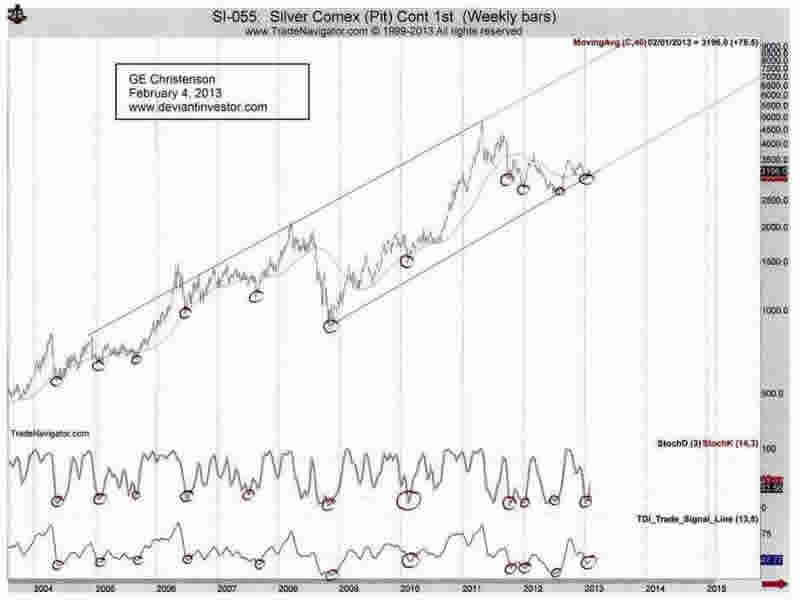
The ten year chart of silver prices is plotted on a logarithmic scale and shows a highly volatile exponential increase in prices over that ten year period. Note the higher trend line extends to approximately $100 by the end of 2013. Prediction – Certainly Not! Possibility – Yes!
The highs in 2004, 2006, 2008, and 2011 were at or above that trend line. A price of $15 in 2006 was just as extreme as a nearly $50 price in 2011 and a possible $100 price within the next two years. Will silver prices spike that high? Time will tell, but before you dismiss such a price as unlikely, consider the following:
- Will the US government balance its budget and eliminate deficit spending? The increase in national debt correlates over the last decade with the increasing prices of silver and gold. Read $4,000 Gold! Yes, But When?
- Will the Federal Reserve reduce the monetary base and cease “printing money?” Eventually consumer price inflation will get much worse, and people will transfer digital money into real money, thereby driving up the prices of gold and silver. What else can the average family do to preserve their purchasing power?
- Will the $700,000,000,000,000 or so in derivatives all “work out well” with no disasters, defaults, or destruction? Consider Enron, Bear Stearns, Lehman Brothers, MFGlobal, Fannie Mae, Greece, Spain, France, missing gold from bank vaults, and peace prospects in Middle East.
- Will the world become a safer and saner place in the next few years? Why have guns sales gone ballistic since early November? Why are certain types of ammunition all but unavailable? Why did the US Mint halt production of Silver Eagles in December? Why did Gold and Silver Eagles set sales records last month? Are conditions in the financial world as optimistic, safe, and sane as the commentators on financial TV want us to believe?
So is $100 silver possible? The better question is “How soon will we see $100 silver?”
Details of the Graphical Analysis
- The chart shows weekly price data plotted on a logarithmic scale. The stochastic and TDI indicators are standard indicators.
- The stochastic indicator is considered “oversold” when it sinks below 20 on a scale from 0 to 100. It is usually considered a “buy-signal” when the stochastic is oversold and then turns higher along with price.
- The TDI (scale 0 to 100) is “oversold” below 50. The best “buy-signals” occur when it is very low – such as 30 – and then turns up.
- The red circles show oversold and turning up Stochastic and TDI conditions along with the price lows in silver.
- Exception: The price low of 2007 occurred after the stochastic indicator turned up but a month before the TDI turned up. The other ten price lows were confirmed by both indicators and price turning up at approximately the same time.
- Each red circle indicates a tradable price low but some were better than others. For example, missing the early 2005 low was unimportant since there was another good low later in 2005. Similarly, the September and December 2011 lows were not as low as the excellent buy point in June 2012.
Technical Analysis – General Comments
As I understand it, there are two main objections to technical analysis. They are, in simple terms:
- Why bother with technical analysis when the silver and gold markets are overwhelmingly manipulated by large traders (JP Morgan, etc.), central banks, and government activities such as the “plunge protection team?”
- Technical analysis does not work anyway.
My response: I think most markets are manipulated or at least managed to some extent. I think the (paper) silver market has experienced short term managed selloffs that have nothing to do with supply and demand in the physical market. (When elephants fight, the grass gets trampled.) The manipulation is short term and makes technical analysis nearly useless during those short term manipulative episodes. But, in the longer term, in my opinion, the manipulation is just “noise” and technical analysis is valuable.
As to the suggestion that technical analysis does not work, I think that is obviously false. The data indicates it does assist in determining the probability that a market will rise or fall. I use it and find value in it.
Conclusion
Approximately once per year the weekly stochastic and weekly TDI indicators have given a “buy-signal” in the silver market. The most profitable buy signals occurred when the TDI was particularly low and silver had just finished a large percentage correction, such as in late 2008 and June 2012. Those indicators have given another weekly “buy-signal” in early January of 2013.
Within the trend channel that stretches back to 2005 there is room for silver to blast higher into the neighborhood of $100 per ounce within the next year or so. It may not rally that high in 2013, but new highs above $50 seem quite likely, based on silver’s price history, the current “buy-signal,” and the financial traumas in the world that are likely to cause additional “money printing” and consumer price inflation.
These financial traumas will create anxiety about the safety and value of unbacked paper money that is being “printed” at an accelerating pace. Gold and silver prices will benefit from that “money printing” and from the resulting anxiety over the loss of purchasing power.
Read Ten Steps to Safety and Why Buy Silver?
Now, look at the above graph of silver again and ask yourself:
- Will the national debt continue its growth toward $25,000,000,000,000 and beyond?
- Will “money printing” (QE-Infinity) continue?
- Will people attempt to protect their purchasing power by selling digital money and buying real assets?
- Will the financial world become less sane and more dangerous over the next several years?
- What happened to silver prices after the other 11 “buy-signals?”
- Consequently are much higher silver prices likely?
GE Christenson
aka Deviant Investor
If you would like to be updated on new blog posts, please subscribe to my RSS Feed or e-mail
© 2013 Copyright Deviant Investor - All Rights Reserved Disclaimer: The above is a matter of opinion provided for general information purposes only and is not intended as investment advice. Information and analysis above are derived from sources and utilising methods believed to be reliable, but we cannot accept responsibility for any losses you may incur as a result of this analysis. Individuals should consult with their personal financial advisors.
© 2005-2022 http://www.MarketOracle.co.uk - The Market Oracle is a FREE Daily Financial Markets Analysis & Forecasting online publication.