


Shake-Up For The Dow Jones 30 Stocks Index
Stock-Markets / Stock Markets 2013 Sep 23, 2013 - 06:47 AM GMTBy: Clif_Droke

 The Dow Jones Industrial Average is getting another makeover this week. On Sept. 20, the Dow 30 stock industrial index will replace three of its older components - Alcoa, Bank of America, and Hewlett Packard - and will replace them with Goldman Sachs, Visa, and Nike. This makes the 52nd time since its inception in 1885 that the index has changed components.
The change was prompted by the underperforming stock prices of the outgoing components, according to a spokesman for S&P Dow Jones Indices. The index committee also cited a desire to diversify as a reason for the change. According to Bloomberg's Nick Taborek, it's the Dow's "biggest reshuffling since April 2004." The Dow's proportions are determined by the dollar value of its constituent stocks, and the addition of the three high-priced stocks will reduce the relative weight of other stocks in the index, significantly boosting the share of financial firms in the index. Visa will carry 7.7% of the Dow's value while Goldman will have 6.9%. Visa and Goldman will also become the second- and third-most important stocks in the index, according to Bloomberg.
Timing is always an issue whenever the Dow 30 index is recast. In seven of the eight previous instances since 1999 when the Dow's components were changed the index was lower within a month. The only exception to this was in Nov. 1, 1999 when the Dow's components were changed and the Dow was higher for the next two-and-a-half months before peaking. In the last 10 years the Dow has always slumped - in varying degrees - in the weeks following realignment.
Could the latest Dow 30 shuffle result in yet another short-term top? Considering the month of September often witnesses a top, and considering that two of the high-profile Dow replacement stocks are hefty financial firms (at a time when pundits are cheering the resurgence of the financial sector), the contrarian play would seem to favor an October pullback for the indices.
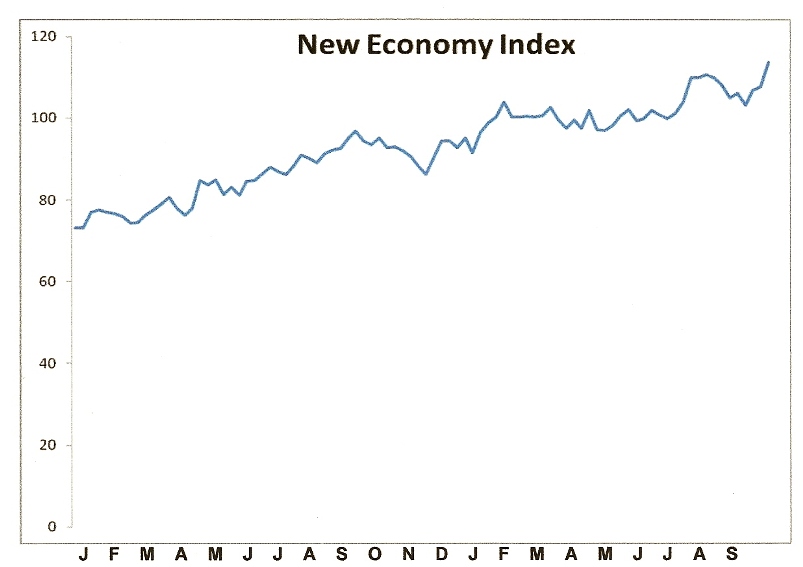
A new high in the NEI
If you noticed a lot of people at restaurants and shopping outlets this weekend, it's because consumers are feeling especially frisky right now. The New Economy Index (NEI), a reflection of the real-time state of the U.S. retail economy, hit a new all-time high on Friday, Sept. 20. This partly reflects the influence of the Fed's recent decision to leave its $85 billion/month monetary stimulus intact.
As long-time readers of this column are aware, until NEI confirms a "sell" signal the overall trend of retail spending is considered to be up. The last time NEI gave a "sell" signal was in early 2010, which proved to be a temporary blip in the long-term recover that started in 2009.
A reader asks, "How did you go about selecting stocks for your New Economy Index? Why didn't you include Apple Inc., which is a highly innovative company involved in new technology and over the years grew rapidly to become the highest valued company in the world by September 2012? Since then Apple's share price has collapsed so it is fortuitous that it isn't in your New Economy Index. Blackberry is another New Economy stock that once flew high but has since fallen on hard times. Manifestly stock selection is critical in the New Economy Index."
Answer: I used the following criteria for selecting NEI components back in 2007:
1.) Must be a company which provides retail employment for millions of Americans (e.g. WalMart), or else a company which reflects the overall employment outlook (e.g. Monster).
2.) Must be a company which adequately reflects consumer spending patterns at traditional "bricks and mortar" outlets (e.g. WalMart), as well as via the Internet (e.g. Amazon).
3.) Must be a company that reflects near-term shifts in consumer spending as well as be a barometer for the small- or home-based business community (e.g. eBay).
4.) Must be a company which is an excellent representation of the transportation sector as it pertains to the shipment of business products, parcels, documents, etc. (e.g. FedEx).
I briefly considered including Apple in the index, but then I realized that Apple is only a small overall slice of the retail economy since it represents a rather narrow industry, namely personal computers. That's not broad enough to merit inclusion in the NEI. The other companies in the NEI are much more diversified and provide a greater range of services, as well as leaving a bigger footprint in the overall economy.
Even though it has been seven years since the New Economy Index was devised, I don't think it could have been constructed any simpler without losing its effectiveness as an economic indicator. It still provides a good overall view of the real-time state of the U.S. retail economy.
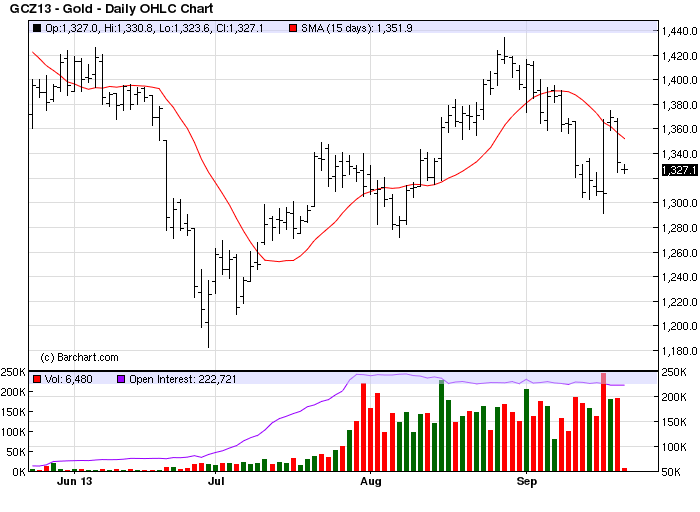
Gold
Turning our attention to the immediate-term outlook for gold, the yellow metal still hasn't managed a 2-day higher close above the 15-day moving average despite its best 1-day performance in four years on Wednesday, Sept. 18. December gold did manage to close above the 15-day MA on Sept. 19, however, and if the December contract can close above the $1,369 level (the Sept. 19 close) we'll have an immediate-term bottom confirmation based on the rules of our technical discipline. For now we remain in a cash position as we await the next confirmed trading signal.
High Probability Relative Strength Trading
Traders often ask what is the single best strategy to use for selecting stocks in bull and bear markets? Hands down, the best all-around strategy is a relative strength approach. With relative strength you can be assured that you're buying (or selling, depending on the market climate) the stocks that insiders are trading in. The powerful tool of relative strength allows you to see which stocks and ETFs the "smart money" pros are buying and selling before they make their next major move.
Find out how to incorporate a relative strength strategy in your trading system in my latest book, High Probability Relative Strength Analysis. In it you'll discover the best way to identify relative strength and profit from it while avoiding the volatility that comes with other systems of stock picking. Relative strength is probably the single most important, yet widely overlooked, strategies on Wall Street. This book explains to you in easy-to-understand terms all you need to know about it. The book is now available for sale at:
http://www.clifdroke.com/books/hprstrading.html
Order today to receive your autographed copy along with a free booklet on the best strategies for momentum trading. Also receive a FREE 1-month trial subscription to the Gold & Silver Stock Report newsletter.
By Clif Droke
www.clifdroke.com
Clif Droke is the editor of the daily Gold & Silver Stock Report. Published daily since 2002, the report provides forecasts and analysis of the leading gold, silver, uranium and energy stocks from a short-term technical standpoint. He is also the author of numerous books, including 'How to Read Chart Patterns for Greater Profits.' For more information visit www.clifdroke.com
Clif Droke Archive |
© 2005-2022 http://www.MarketOracle.co.uk - The Market Oracle is a FREE Daily Financial Markets Analysis & Forecasting online publication.