


Gold and Silver Back Story vs Charts; Charts Are Superior
Commodities / Gold and Silver 2013 Oct 20, 2013 - 03:07 PM GMTBy: Michael_Noonan

 Almost everybody wants a back story, some information to explain what is going on with gold and silver, mostly looking for some kind of psychological calm as prices decline, or a ray of hope to reinforce why price may reach the sun and the moon. Is there anything that has not been presented, repackaged and represented that has not already been more than fully covered to justify much higher price levels? Have any of them achieved what was promised?
Instead of exceptionally higher prices, as a counter to the exceptionally dire reports of the demise of central banks, their [lack of] gold holdings, the precipitously low COMEX and LBMA inventories for the metals, the inability to make good on deliveries over the past few months, etc, etc, prices continue to probe the recent lower levels without any signs of a turnaround. Guess those valid "fundamental" reasons were insufficient to lift prices up.
What about the state of the United States? It's broke, and broken. The acknowledged national debt is around $17 trillion, or about $53,000 for every man woman and child in the country. The real debt is more like $125 trillion, and that equates to about $360,000 that every man, woman, and child is responsible for paying. Are you willing to pay that amount, the one your government has run up for you with the prodding of the NWO's Federal Reserve central bank? Is the world's "richest" [richest in terms of debt] country that has not been paying its bills enough of an impetus to send gold and silver higher?
Apparently not.
What about King Draghi? As bad a shape as the US is in, Europe is worse. Last week, he just informed the world that steps would be needed to "recapitalize" the banks. Does anyone not stop and demand accountability for the previous capital the banks lost? And why are bank depositors responsible for bailing-outs through bail-ins? Why aren't the bankers making up for their own losses, or going out of business like an non-banking entity would do when faced with insurmountable losses?
Back to Draghi. He and his other unelected band of thieves that form the EU in Brussels have decided:
"The effectiveness of this exercise will depend on the availability of necessary arrangements for recapitalizing banks ... including through the provision of a public backstop," Mario Draghi explained on Friday to set the mood for today's meetings. "These arrangements must be in place before we conclude our assessment."
The "assessment" under consideration is just how severely broke and illiquid the already failed banks are and how much will be required, how did he express it? Yes, "through the provision of a public backstop." Be prepared for more financial rape and pillaging, for it is sure to come.
The most reliable current story is found in the charts. Why is this so? Like we say, do not listen to what people are saying about the markets, listen to what the markets are saying about the people.
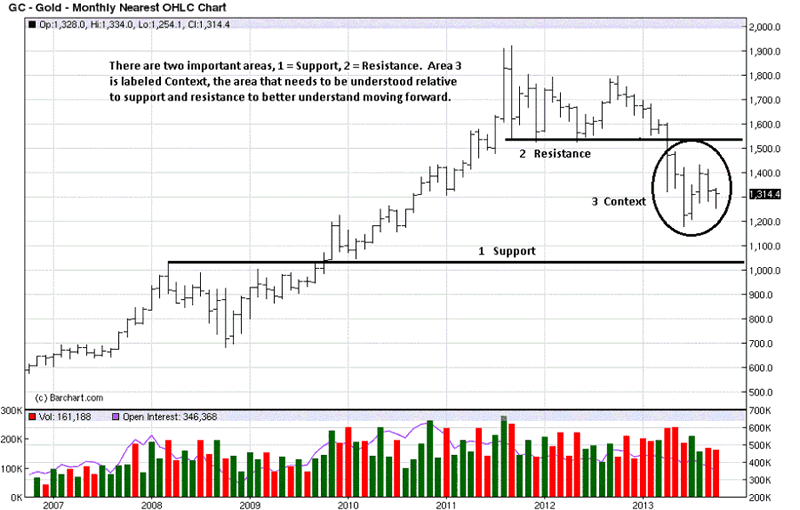
The higher the time frame, the more controlling the information because it takes a lot more effort over time to evince a change. Price has been put into a context between the current important current levels of resistance and support. Once price broke the 1525 area, last April, that support became resistance, and the market announced to the world that sellers were now in total control.
The overall trend, since 2008 and earlier, is up but weakened on the monthly time frame. April is when the central bank/JP Morgan moved to force price lower. Artificially or just plain manipulation does not matter, for the effort succeeded, despite all the positive news, you know, those things people were saying about the market. The market had a different message.
In May, on the same level of high volume as the previous month, the bar narrowed significantly. Buyers were meeting the effort of sellers, which is why that bar did not extend lower. However, the fact that the location of the bar was at the lower half of the April range, and the close was well under April's, told us that buyers won that battle, but the war was not over, as the next month clearly showed.
June saw another central bank-sponsored "intervention" to suppress the price of gold, [in order to keep the fiat Federal Reserve Note propped up]. Price closed poorly on another wide range down bar. The decline continues.
Well, not in July, [4th bar from right]. Not only was there no further downside, the exact opposite of reasonable expectations, the volume increased and price closed near the high. Clearly, buyers won another battle. The terms "battle" and within a "war" are apt, because what we are seeing now is a struggle between buyers and sellers which is in contrast to sellers having previously been in total control.
As was said, it takes more effort and time to effect a change on this higher time frame, and what you see, since the June decline, are overlapping bars within the June range, a sign of struggle between the forces of supply and demand.
The August rally, 3rd bar from right, had a decrease in volume which meant less buyers, even though price closed higher, again, but stopped at the June range high, evidence of ongoing resistance. However, we may be seeing a subtle change in behavior. The last two bars have narrowed while in a relatively slight decline mode, October still in progress.
While August showed a decrease in volume and the rally stopped at the June high, the last two months' total volume is much great than that of August, yet two months of effort to get price lower has not worked. Recall the most recent assault on gold, a 2,000,000 ounce sell order at one time. It does not even register on the chart, unlike the similar blatant sells in April and June.
The monthly chart is telling us the downside momentum has lost momentum. This can change in the next few days or few weeks, but the future has not yet happened, so we can only deal with what is known, at this point in time. With this context, we look to the lower weekly and daily time frames to see if a clearer message emerges.
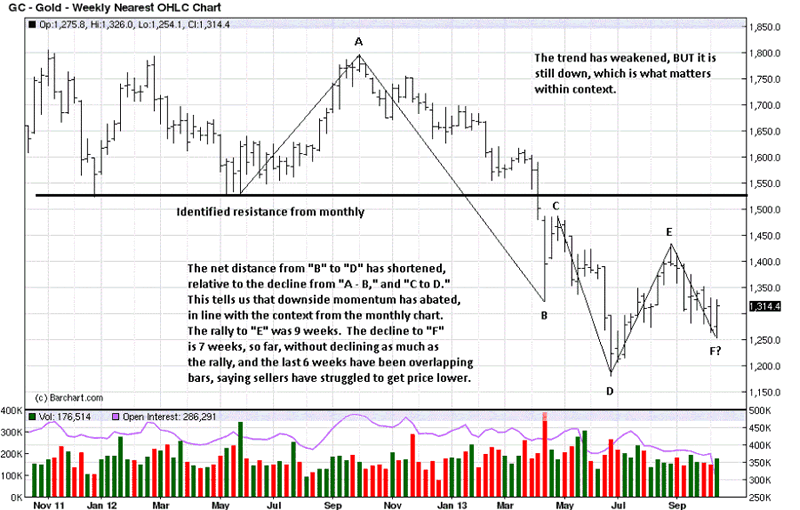
The lines connecting the recent swing highs and lows shows how the momentum has slowed. The net decline at "D" is far less than the decline from "A" to "B." Notice the two bars leading into the lows at "B" and "D," both wide range with little to no overlap. The current decline into "F," [? = may or may not be over], has overlapping bars, the opposite of previous lows and in keeping with the small sign of potential change evidenced on the monthly chart. What is lacking in both time frames is confirmation of an actual change.
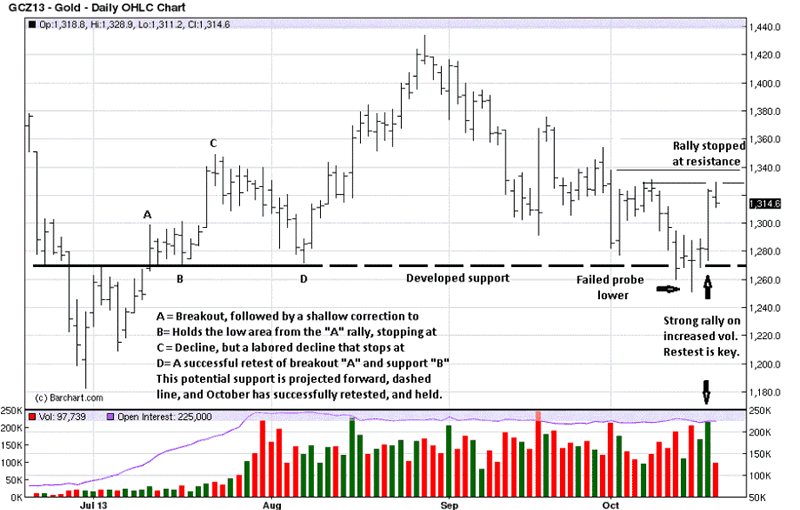
The comments on the daily shows the interchange of past behavior being somewhat determinative of future behavior. The development on the left side of the chart, A, B, C, D, gave reason for why the recent activity unfolded as it did, on the right side of the chart.
After the failed probe lower, [4th bar from right], an indication that sellers failed to show up when it was opportune to drive price lower, [like a 2 million oz order was not enough], we get confirmation of sellers being AWOL with Friday's strong rally, strong close, and increased volume. Just as one swallow does not a summer make, one bar, especially on this lower time frame, does not a bull market make, but it is a sign of change.
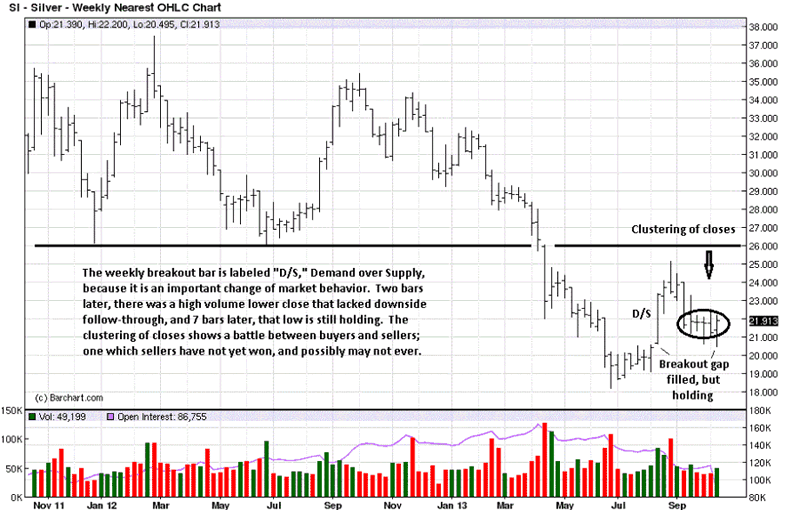
The rally did stop at/below two small failed rally highs. What will be key is how price corrects Thursday's rally bar. Maybe we should have labeled it D/S, Demand over Supply, for it is warranted by that show of activity. If it is real, we should see smaller bars and less volume on any retest of the bar, classically. If volume does increase, the largest increase should occur at/near the low of the correction. Time will tell.
The analysis for gold facilitates an easier read for silver, under similar circumstances, but silver still showing a greater propensity to hold its recent lows. The lows can still give way, but sellers will have to show up with greater sway that is being evidenced by buyers.
The level of support is at a stronger support level than for gold. Keep in mind, however, the fact that gold has not declined as far into a past support range makes a greater bullish statement for that very reason.
The August rally, [3rd bar from right], is being retested by smaller ranges, what one would expect to see if a retest of a recent rally bar is to successfully hold. October has not yet finished, so the reservation of anything can happen remains in play, for the upside as well as the downside.
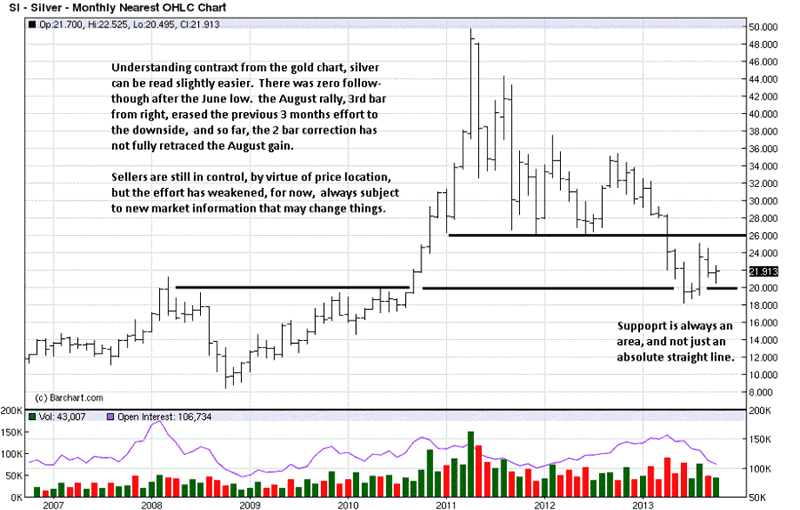
We deemed the breakout gap important when it happened, and while the gap was filled, one can count the fill in minutes before price rallied back higher, so it remains significant.
The clustering of closes is usually consolidation before price resumes the previous trend, OR it can signify a turnaround. The tight closes and overlapping of bars for the past six weeks lets us know of the balance, [still viewed as a battle with no declared winner, yet], and from balance comes unbalance. The farther price moves along the RHS [Right Hand Side] of any trading range, the closer is the resolve. The fact that last week was a KR one, [Key Reversal], and the highest close of the past six weeks, speaks to buyers attempting to wrest control from sellers.

Previously, we said price needs to get above 22 and demonstrate an ability to hold. It is close, and you can also see 22.50 creates the same agenda of proof. The daily trend has weakened, from a sellers perspective. The burden of proof for change remain with buyers.
Expect to always see evidence of change in the charts, first. On that you can rely.
Continue, maybe even with a far greater sense of urgency, to buy and personally hold, both physical metals, gold and silver. No one can accurately measure when central bankers will lose total control, but the signs are building. When the ultimate pressure is too great to contain, price will explode upside, leaving behind those who thought they were smart enough to get a better price or "see" more evidence of the obvious.
By Michael Noonan
Michael Noonan, mn@edgetraderplus.com, is a Chicago-based trader with over 30 years in the business. His sole approach to analysis is derived from developing market pattern behavior, found in the form of Price, Volume, and Time, and it is generated from the best source possible, the market itself.
© 2013 Copyright Michael Noonan - All Rights Reserved Disclaimer: The above is a matter of opinion provided for general information purposes only and is not intended as investment advice. Information and analysis above are derived from sources and utilising methods believed to be reliable, but we cannot accept responsibility for any losses you may incur as a result of this analysis. Individuals should consult with their personal financial advisors.
Michael Noonan Archive |
© 2005-2022 http://www.MarketOracle.co.uk - The Market Oracle is a FREE Daily Financial Markets Analysis & Forecasting online publication.