


US Stock Market The Great American Wall Of Worry
Stock-Markets / Stock Markets 2013 Oct 25, 2013 - 04:44 PM GMTBy: Chris_Vermeulen

 Traders and investors all around the world is having trouble climbing over the wall of worry/fear with the US stock market, and rightly so. There is a lot of things taking place and unfolding that carry a high level of uncertainty. Let’s face it, who wants to invest money into the market when it’s hard to come by (high unemployment, banks are still extremely tight with their money, companies are nowhere near wanting to hiring new staff).
The hard pill to swallow is the fact that the stock market loves to rise when uncertainty is high. It’s almost doing it just to drive investor’s nuts who sold out near market bottom or recent correction. You must overcome the urge to short the market when the economy looks so bearish in the years ahead, and continue to trade with the trend.
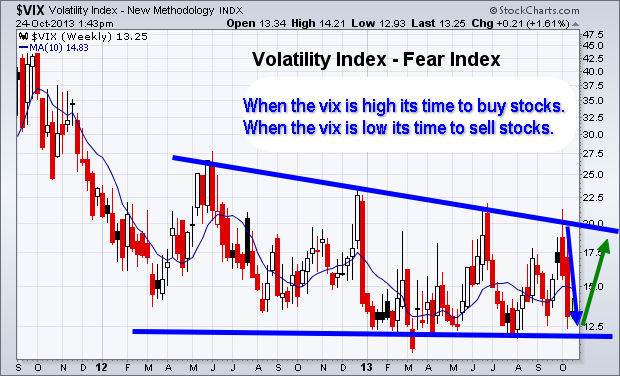
Short Term Investing – Weekly Volatility Index Chart
Below you can see the fear index. The chart is self-explanatory showing where it should move next. But if you are not familiar with the VIX then here is definition by investopedia:
“The first VIX, introduced by the CBOE in 1993, was a weighted measure of the implied volatility of eight S&P 100 at-the-money put and call options. Ten years later, it expanded to use options based on a broader index, the S&P 500, which allows for a more accurate view of investors’ expectations on future market volatility. VIX values greater than 30 are generally associated with a large amount of volatility as a result of investor fear or uncertainty, while values below 20 generally correspond to less stressful, even complacent, times in the markets.”
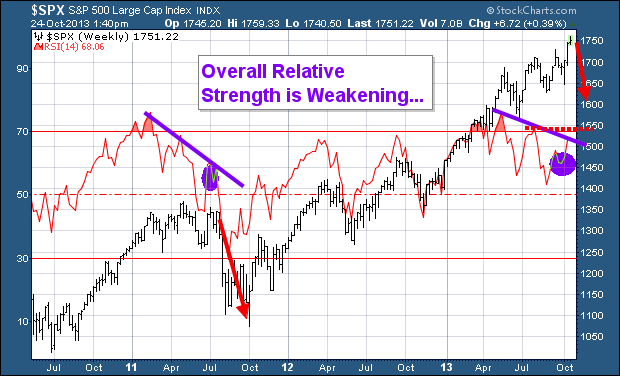
Weekly Investing Chart of the SP500 Index
After reviewing the VIX chart above which points to stocks nearing a level of selling pressure, then review the chart below we come to a conclusion that a minor pullback of 2-5% is likely to take place in the next week ortwo.
The divergence in the Relative Strength Index is a bearish sign for the broad market. While I feel a pullback is do and needed for the market to regroup, it is important to review the seasonality chart and know that we are entering one the strongest times of the year for stocks.
SP500 Seasonality Chart
Again, using the data from the previous two charts along with this graph clearly shows that a pullback in the stocks is likely going to be bought back up by the brave investors willing to override their fear and go with the trend. For more interesting charts check out my stock chartlists: https://stockcharts.com/public/1992897
The Wall Of Worry Conclusion:
In short, expect the stock market to correct in the next week or two. But once we get a correction of two percent or more, be prepared for buyers to step back in and buy things up into year end.
This WALL OF WORRY is about to GET HIGHER!
If you would like to keep up to date on market trends and trade ideas be sure to join my newsletter at http://www.thegoldandoilguy.com
By Chris Vermeulen
Please visit my website for more information. http://www.TheGoldAndOilGuy.com
Chris Vermeulen is Founder of the popular trading site TheGoldAndOilGuy.com. There he shares his highly successful, low-risk trading method. For 7 years Chris has been a leader in teaching others to skillfully trade in gold, oil, and silver in both bull and bear markets. Subscribers to his service depend on Chris' uniquely consistent investment opportunities that carry exceptionally low risk and high return.
This article is intended solely for information purposes. The opinions are those of the author only. Please conduct further research and consult your financial advisor before making any investment/trading decision. No responsibility can be accepted for losses that may result as a consequence of trading on the basis of this analysis.
Chris Vermeulen Archive |
© 2005-2022 http://www.MarketOracle.co.uk - The Market Oracle is a FREE Daily Financial Markets Analysis & Forecasting online publication.