


Quantifornication - Did Bernanke Get It Right?
Interest-Rates / Quantitative Easing Dec 31, 2013 - 04:55 PM GMTBy: Richard_Mills

 The Federal Reserve thinks recent economic news from the U.S. is good:
- Jobs are being created
- Consumers are spending money
- Trade & manufacturing growth is strong
So on Dec. 18th 2013, they announced a decelerating QE III environment.
"In light of the cumulative progress toward maximum employment and the improvement in the outlook for labour market conditions, the committee decided to modestly reduce the pace of its asset purchases." ~ outgoing chairman of the Federal Reserve, Ben Bernanke
If job gains continue and inflation increases, "I imagine we'll continue to do, probably at each meeting, a measured reduction in buying." Fed Chairman Ben S. Bernanke
Current Federal Reserve Chairman Ben Bernanke will be replaced, early in the new year, by Janet Yellen who is said to have endorsed the tapering decision.
The Fed reiterated that it plans to hold its key short-term rate at a record low, "well past the time that the unemployment rate declines below 6.5 per cent" and the inflation outlook remains mild. The Fed has held the fed-funds target rate between zero and .25% since 2008.
"To support continued progress toward maximum employment and price stability, the Committee today reaffirmed its view that a highly accommodative stance of monetary policy will remain appropriate for a considerable time after the asset purchase program ends and the economic recovery strengthens. The Committee also reaffirmed its expectation that the current exceptionally low target range for the federal funds rate of 0 to 1/4 percent will be appropriate at least as long as the unemployment rate remains above 6-1/2 percent, inflation between one and two years ahead is projected to be no more than a half percentage point above the Committee's 2 percent longer-run goal, and longer-term inflation expectations continue to be well anchored." ~ Federal Reserve
Background Leading to Quantitative Easing
Overheated US housing prices started dropping in 2006. Homeowners were going underwater (they owed more than the house was worth) and many had questionable credit - "fog the mirror loans" were common, if you breathed you got a loan. Banks sold these mortgages to agencies like Fannie Mae and Freddie Mac. They bundled the mortgages with other loans bearing similar interest rates and then sold them as Mortgage-backed securities (MBS), so called because their value was backed or secured by the value of the underlying mortgages.
An MBS is therefore a derivative because its value is derived from the underlying asset - the mortgage that was often underwater and held by someone with bad credit.
The Federal Reserve started easing monetary policy aggressively throughout 2008. By December of 2008, the federal funds rate was between 0 and 1/4 percent. Additional stimulus was injected by expanding the holdings of longer term securities. The System Open Market Account (SOMA) purchased mortgage-backed securities guaranteed by Fannie Mae, Freddie Mac, and Ginnie Mae (agency MBS).
Broad Based Programs
"On numerous occasions in 2008 and 2009, the Federal Reserve Board invoked emergency authority under the Federal Reserve Act of 1913 to authorize new broad-based programs and financial assistance to individual institutions to stabilize financial markets. Loans outstanding for the emergency programs peaked at more than $1 trillion in late 2008." ~ Government Accountability Office (GAO)
The Term Auction Facility was $40 billion in loans to rescue the banks. It wasn't near enough, the Treasury department got authorization to spend $150 billion more to subsidize and eventually take over Fannie Mae and Freddie Mac, they also bailed out AIG.
Dollar Swap Lines exchanged dollars with foreign central banks for foreign currency to help address disruptions in dollar funding markets abroad.
The Term Securities Lending Facility auctioned loans of U.S. Treasury securities to primary dealers against eligible collateral.
The Primary Dealer Credit Facility provided overnight cash loans to primary dealers against eligible collateral.
The Asset-Backed Commercial Paper Money Market Mutual Fund Liquidity Facility provided loans to depository institutions and their affiliates to finance purchases of eligible asset-backed commercial paper from money market mutual funds.
TheCommercial Paper Funding Facility provided loans to a special purpose vehicle to finance purchases of new issues of asset-backed commercial paper and unsecured commercial paper from eligible issuers.
The Term Asset-Backed Securities Loan Facility supported the issuance of asset-backed securities (ABS) collateralized by loans related to autos, credit cards, education, and small businesses. In March 2009, the Fed announced that it was expanding the scope of the TALF program to allow loans against additional types of collateral.
Late in 2008 there was a run on ultra safe money market accounts - according to AMG Data Services a record $140 billion was pulled out in one day.
The Troubled Asset Recovery Program was proposed and $350 billion was approved by Congress - the money was used to buy bank and automotive stocks.
The initial Fed response to the subprime mortgage crisis was to lower interest rates, then, having no traditional tools left in its toolbox the Fed introduced a new policy - quantitative easing (QE).
Quantitative Easing
In September of 2008 the $1.7 trillion QE1 was started. The Fed purchased mostly mortgage backed securities and established a commercial paper lending facility.
In October of 2010 QE2 started. At $600 billion, QE2 was much smaller then QE1 and its buying was mostly confined to purchasing long term government bonds.
Operation Twist
In September 2011, the Fed launched Operation Twist. Operation Twist is the Fed's initiative of buying longer-term Treasuries while simultaneously selling shorter-dated issues in order to bring down long-term interest rates.
By purchasing longer-term bonds, the Fed drives up prices which forces yields down - price and yield move in opposite directions. Selling shorter-term bonds causes their yields to go up because their prices fall. These two actions "twist" the shape of the yield curve, hence the name Operation Twist.
On September 13, 2012, the Fed announced QE3. It agreed to buy $40 billion in MBS, and continue Operation Twist, adding a total $85 billion of liquidity a month. Key components are:
- The creation of $40 billion a month to buy MBS's
- The continuation of Operation Twist #2
- An open-ended commitment to keep purchasing securities at whatever level is judged necessary until the labor market improves "substantially"
- An extension of the 0.0% to 0.25% target range for the Fed Funds rate until at least mid 2015
On December 18th the Fed announced a QE3 tapering of $10b a month, the first cutback in bond purchases was to be split evenly between the purchases of MBS's and Operation Twist.
Quantitative Easing Success?
Let's take a look at why the Fed decided to start tapering.
Below are two charts showing the effects of the successive Quantitative Easing and Twist programs on the DOW.
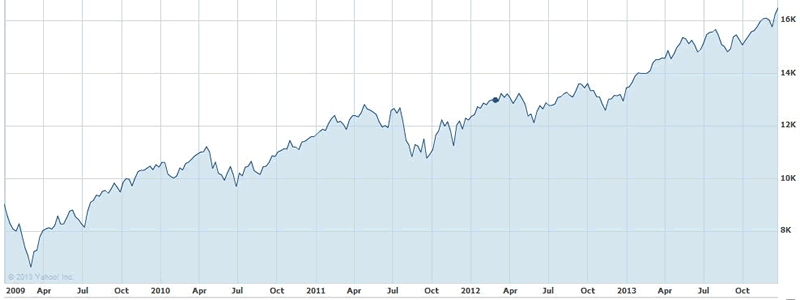
The Federal Reserve started QE I November 25th, 2008. QE II was started in June 2011. In September 2011, the Fed launched Operation Twist. On September 13, 2012, the Fed announced QE3.
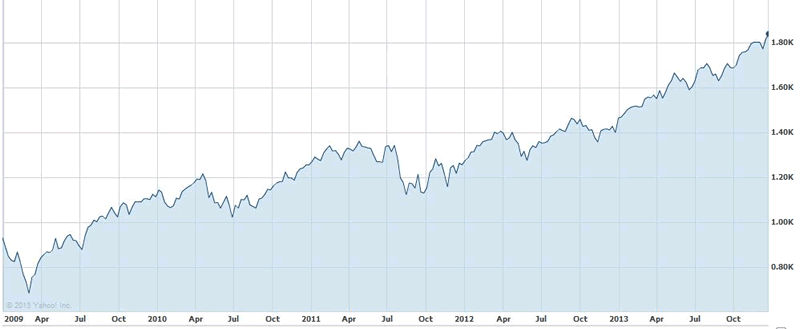
Below is a five year chart of the S&P 500.
Industrial Production in the United States increased 3.20 percent in November of 2013 yoy. Industrial Production in the U.S. has averaged 3.90 percent from 1920 until 2013.
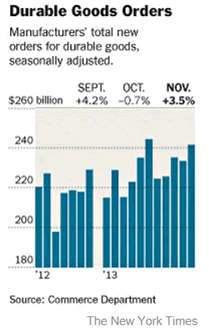
Durable goods orders jumped 3.5 percent in November as demand increased for a range of goods, including aircraft, machinery, and computers and electronic products.
Core capital goods, a category that tracks business investment, rose 4.5%, the biggest gain since January. This category is seen as a gauge of business plans to expand and modernize and as a measure of business confidence.
"The increases in these so-called core capital goods orders and in durable goods orders over all suggested strength in manufacturing and were further evidence of a firming economic growth outlook." ~ REUTERS, Orders for Durable Goods Surged 3.5% in November
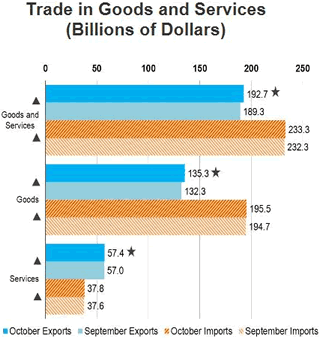
October 2013 Trade Highlights
-
October exports of goods and services ($192.7 billion), exports of goods ($135.3 billion), and exports of services ($57.4 billion) were the highest on record.
-
October imports of goods and services ($233.3 billion) were the highest since March 2012 ($234.3 billion).
-
October petroleum exports ($12.5 billion) were the highest on record.
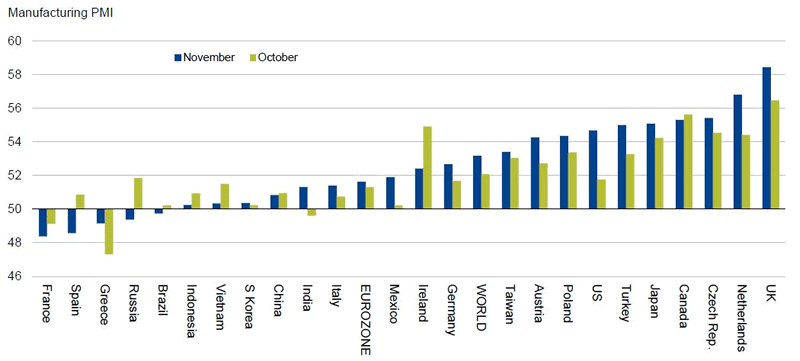
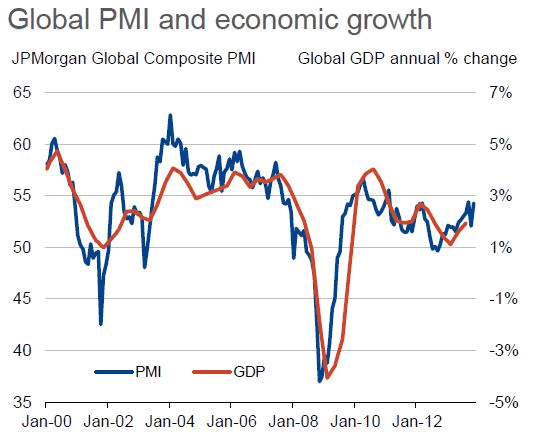
The two charts below, from Markit Economics, suggest the pace of global expansion, although uneven, has risen substantially over the past year. At the forefront of the year long expansion are upturns in both manufacturing and global trade.
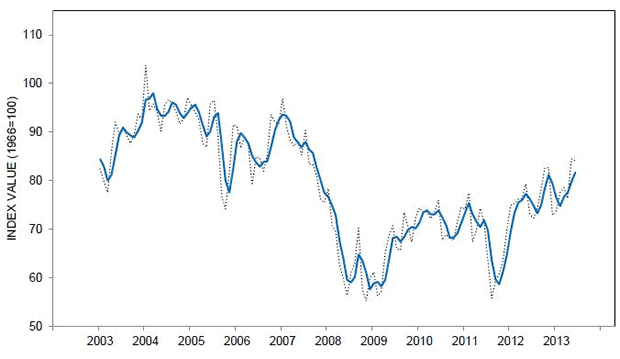
Consumer spending is a key driver of growth in the U.S., providing two-thirds of economic demand. GDP and employment are backward-looking indicators. For clues to the future look at sentiment surveys. The Thomson Reuters/University of Michigan index of consumer sentiment rose to 82.5 in December from 75.1 in November.
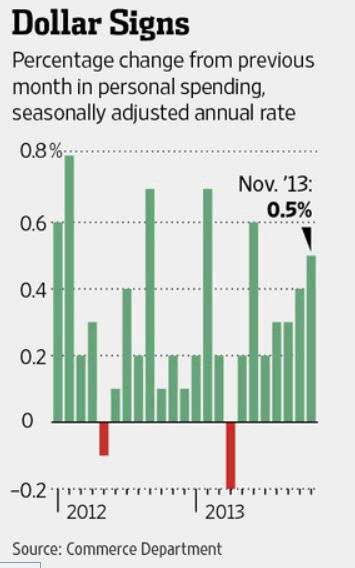
Consumer spending is slowly climbing. From the Wall Street Journal we get the following chart.
What about a housing recovery, after all that's what started this mess way back in 2006.
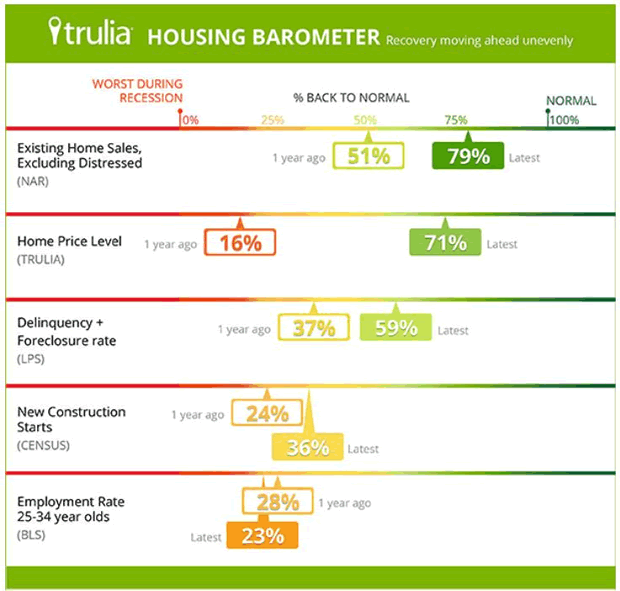
Trulia's Housing Barometer shows that 3 of the 5 key housing indicators are on track towards a full recovery:
- Non-distressed sales and home prices are approaching normal levels and could reach them in 2014.
- Delinquencies + foreclosures are improving although normal might not be reached until late 2014 or early 2015.
The red flags are construction starts and young-adult employment, both of which are definitely closer to recession levels than to normal. However if you believe all the data presented you won't have much of a hard time believing these two will come around given time.
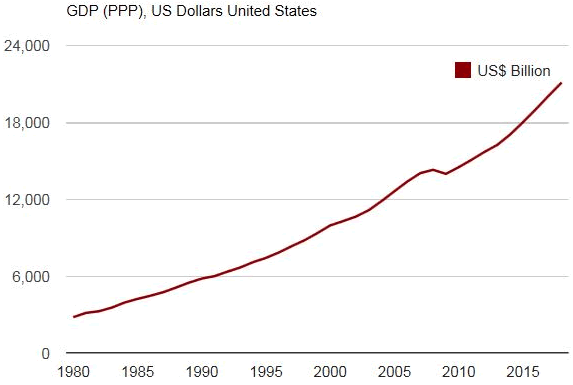
U.S. GDP is creeping up.
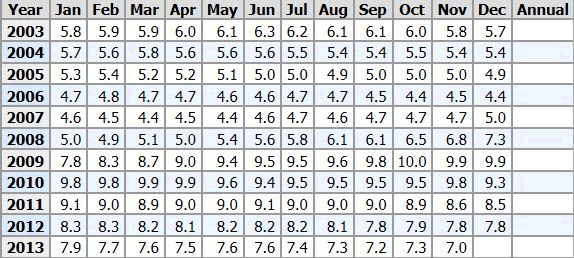
U.S. unemployment numbers are slowly edging down and are almost back to pre-November 2008 levels.
The Deficit seems to be coming under control. The following is from the U.S. Congressional Budget Office (CBO).
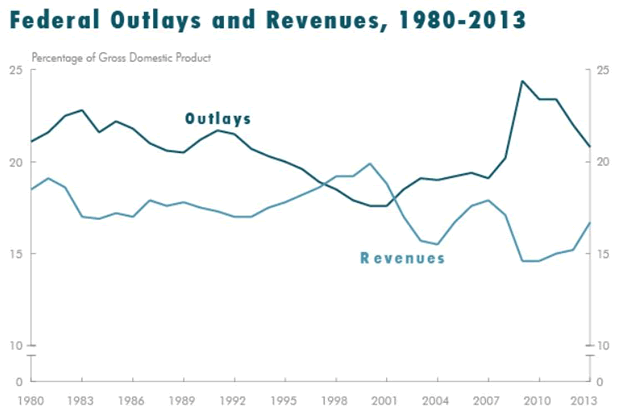
"The federal government incurred a budget deficit of $680 billion in fiscal year 2013, which was $409 billion less than the deficit in fiscal year 2012. The fiscal year that just ended marked the first time since 2008 that the deficit was under $1 trillion. As a share of the nation's gross domestic product (GDP), the deficit declined from 6.8 percent in 2012 to 4.1 percent in 2013. The deficit was 1.1 percent of GDP in 2007, prior to the recent recession."
Interest rates
The Fed has moved to a tighter monetary stance while most other major central banks - except the Bank of England - have moved to a looser one. You would have to think that's dollar supportive - meaning a stronger dollar. BUT, the Federal Reserve's forward guidance pledging to keep short-term interest rates low is going to counteract that until rates do indeed start to rise.
A sharp narrowing of the yield differences - from 2.55% to 2.15% - between medium (five year) and long-dated (30 year) treasuries since the Fed announced the taper start is an excellent gauge as to how traders' view changes in the Fed's interest rate policy and its bond purchase program. The narrowing means traders are worried the Feds forward guidance of keeping short-term policy rates near zero if unemployment stays high and inflation remains stuck below its 2 percent target does not carry a lot of credibility.
Currently Federal funds futures are implying traders are pricing in a 56 percent chance of a rate rise in June 2015, up from 39 percent from a month ago.
If the Fed aren't buying, and indeed might become net sellers of their $4t balance sheet, other parties are going to have to pick up the slack. And that means higher interest rates are going to be needed to entice future buyers of government debt if the Fed, as buyers of last resort, quit buying.
Interest rates matter, they matter a lot, they affect the cost of borrowing for homes and business investment. They effect the rates paid on deposits and savings and they set the risk-free rate of return which is important for assessing returns from other asset classes like shares, bonds, precious metals, commodities and property. Here's an excellent example - an increase in Treasury yields means a return to a positive real interest rate environment which, historically, is a headwind for gold prices.
Reversal
The economic news certainly isn't all rosy, just do a little digging. Remember there's still a $761b deficit (I reported the deficit as $680b, it was but it counted a one-time Fannie Mae $50b payment and a $30b deferred payment). The quality of jobs being created is suspect, most are part time/low wage positions, and income isn't climbing. Also worrisome is the fact the much talked about increase in consumer spending is from existing savings, that's not sustainable even in the short term. Of course, from an historical viewpoint the housing market still looks weak in all of Trulia's Housing Barometer five sectors.
Could tapering be reversed? Of course it could, Ben Bernanke, outgoing Federal Reserve chief might of shut QEIII down too early (he has twice before w/QEI&QEII, maybe third time lucky?). Bernanke just committed to showing the world his policies have been, are, a success. If they were he wants the credit, not have it given to his successor. If he's wrong, well there's always Yellen to take the blame for torpedoing his economic recovery.
Conclusion
It certainly appears that there's a global recovery underway and it's being led by the U.S. The Fed has even given itself a successful report card and started to taper.
Expect a stronger U.S. dollar and higher interest rates late in 2014 or early 2015.
Is that on your radar screen?
If not, it should be.
By Richard (Rick) Mills
If you're interested in learning more about the junior resource and bio-med sectors please come and visit us at www.aheadoftheherd.com
Site membership is free. No credit card or personal information is asked for.
Richard is host of Aheadoftheherd.com and invests in the junior resource sector.
His articles have been published on over 400 websites, including: Wall Street Journal, Market Oracle, USAToday, National Post, Stockhouse, Lewrockwell, Pinnacledigest, Uranium Miner, Beforeitsnews, SeekingAlpha, MontrealGazette, Casey Research, 24hgold, Vancouver Sun, CBSnews, SilverBearCafe, Infomine, Huffington Post, Mineweb, 321Gold, Kitco, Gold-Eagle, The Gold/Energy Reports, Calgary Herald, Resource Investor, Mining.com, Forbes, FNArena, Uraniumseek, Financial Sense, Goldseek, Dallasnews, Vantagewire, Resourceclips and the Association of Mining Analysts.
Copyright © 2013 Richard (Rick) Mills - All Rights Reserved
Legal Notice / Disclaimer: This document is not and should not be construed as an offer to sell or the solicitation of an offer to purchase or subscribe for any investment. Richard Mills has based this document on information obtained from sources he believes to be reliable but which has not been independently verified; Richard Mills makes no guarantee, representation or warranty and accepts no responsibility or liability as to its accuracy or completeness. Expressions of opinion are those of Richard Mills only and are subject to change without notice. Richard Mills assumes no warranty, liability or guarantee for the current relevance, correctness or completeness of any information provided within this Report and will not be held liable for the consequence of reliance upon any opinion or statement contained herein or any omission. Furthermore, I, Richard Mills, assume no liability for any direct or indirect loss or damage or, in particular, for lost profit, which you may incur as a result of the use and existence of the information provided within this Report.
Richard (Rick) Mills Archive |
© 2005-2022 http://www.MarketOracle.co.uk - The Market Oracle is a FREE Daily Financial Markets Analysis & Forecasting online publication.