


Stock Market Anticipated Intermediate Decline Has Started
Stock-Markets / Stock Markets 2014 Jan 27, 2014 - 05:13 AM GMTBy: Andre_Gratian

 Current Position of the Market
SPX: Very Long-term trend - The very-long-term cycles are in their down phases, and if they make their lows when expected (after this bull market is over), there will be another steep decline into late 2014. However, the Fed policy of keeping interest rates low has severely curtailed the full downward pressure potential of the 40-yr and 120-yr cycles.
Intermediate trend - The anticipated decline into late February has started.
Analysis of the short-term trend is done on a daily basis with the help of hourly charts. It is an important adjunct to the analysis of daily and weekly charts which discusses the course of longer market trends.
THE ANTICIPATED INTERMEDIATE DECLINE HAS STARTED
Market Overview
The stock market has been preparing for an important correction for some time, but it needed a catalyst to get it started. This was provided by news from China last week which triggered a sell-off in emerging markets and spread to other markets as well. But there are problems for economies and stock markets elsewhere: In the Middle-east, in Argentina and Brazil, etc... It looks to me as if the long-term Kress cycles that I have been warning about for months are finally taking control of the markets around the world.
That does not mean that the current weakness in the SPX is a sign that its bull market is over. It's much too soon to make that statement. The current decline is expected to continue until late in February, after which the SPX will have a chance to prove that it can still make a new high before putting an end to its bull run. The weekly charts are not showing the loss of momentum which is normally associated with an important top. In addition, the NDX and RUT -- two indexes that tend to lead the SPX by showing relative weakness at the end of a bull market -- were actually stronger on the day that the decline started. This made the sell-off a little more difficult to time precisely, especially since SPX had a slightly higher price projection which it seemingly wanted to reach before starting to re-trace. Obviously to news from China took most everyone by surprise.
So what can we expect next? To begin with, there is a very good chance that the current 61-point decline will be arrested on Monday just a few points lower than where it closed on Friday. We have nearly arrived at an important P&F phase projection which matches a Fib target, and the hourly oscillators are beginning to show a hint of deceleration -- normally not quite enough preparation to cause a reversal, but close! This should put an end to the first phase of the correction and be followed by a rally in a downtrend. After that, the entire correction should consist of at least one more selling phase into late February which should take the market lower.
Chart Analysis
We can probably achieve the proper perspective about the current market condition from the SPX daily and SPX hourly charts (courtesy of QCharts) . Let's start with the daily!
I have drawn several channels, starting with the bull market channel which originated in March 2009. The others are drawn and labeled somewhat arbitrarily in an attempt to isolate the various market phases comprising the entire bull market. As you can see, the current decline is still contained within the 5-month "short-term" channel which started in late August of last year. If you consider the fact that the bottom trend line of the bull market channel currently runs at about 1540, and that it will have to be broken as a confirmation that the bull market is over, AND the fact that we just touched the top of that channel -- and indication that there is no long-term trend deceleration -- it could be a while before we can claim that the bull market is over.
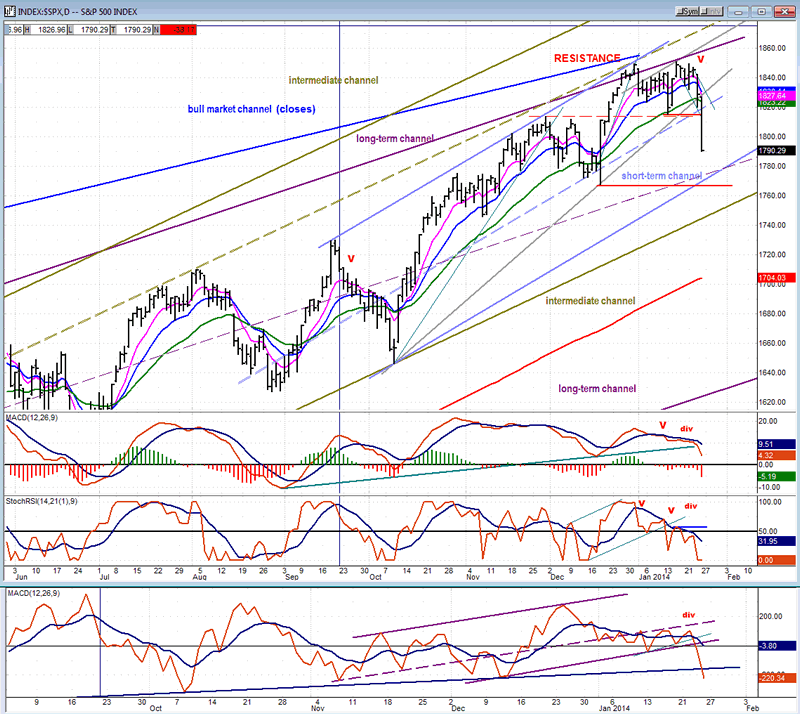
If we are to trade below that channel line over the next 8-9 months we will have to drop some 300 points - perhaps more if we go higher, first! The cycles that are scheduled to bottom in the fall are certainly capable of producing that kind of retracement in that time span, but this is something to worry about later. For now, let's concern ourselves with the current trend.
There was ample warning that the uptrend was coming to an end. The three oscillators had been screaming negative divergence for two weeks and more. With last week's action, they have all given a strong sell signal, except that MACD is still positive -- though it shouldn't be for much longer! After putting up a half-hearted fight, the trend line from the October low has now been decisively penetrated, and the index's next challenge will be to break out of the short-term channel and trade below the former low of 1768. This is unlikely to be done before we have a counter-trend rally.
We'll now look at the hourly chart to see in more detail where we are, and where we are going. Here, the channels drawn are even more arbitrarily because I am half-guessing at where the current decline is going to end. They will be adjusted later.
The chart shows the price formation which spans a two-week time frame since the beginning of the year. There are two distinct phases that are separated by a quick drop in prices about halfway through, followed by an equally quick rally to the vicinity of the first high. The sideways pattern which had characterized trading since the first of the year then resumed. On a Point & Figure chart, this takes the form of an inverted fulcrum, one of the most reliable formations to count.
The two phases are clearly marked by a heavy grey line across their "walls". Phase II had given us a count to about 1795 for the initial decline, which could be extended to about 1783. Since we closed at 1790.75 on Friday, I suspect that SPX wants to fill the extension as well -- something which could be done in the first couple of hours on Monday.
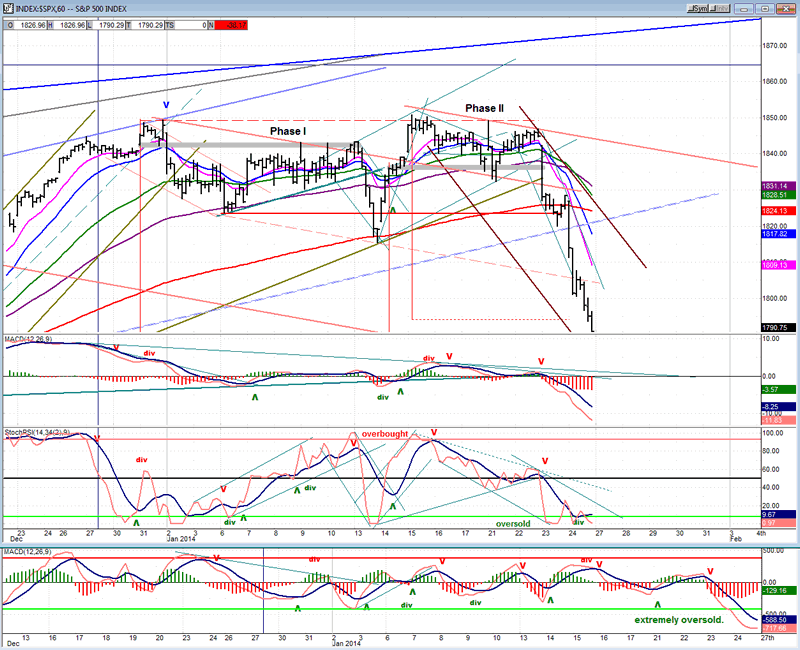
Following the counter-trend rally which should develop subsequently, the odds are pretty good that phase 1 will have to be satisfied as well, especially since our time projection for the low is about a month away. That should be our expectation but, since no market forecast can ever be absolute, let's simply monitor the market action carefully over the next couple of weeks and see if this is what it intends to do. If phase 1 is realized, we can expect that Monday's low might turn out to be only the halfway point of the decline, not only in time, but possibly in price as well.
How much of a rally can we expect after Monday? Fibonacci retracement figures are usually pretty reliable and we should watch for something in the vicinity of .382 and .50 of last week's drop in prices.
Cycles
The cycles due toward the end of February have started to exert pressure on the market - probably assisted by the longer-term cycles bottoming in the fall. It is too soon to determine if these will keep things going until then, or if the market will be allowed to make a new high, first.
Breadth
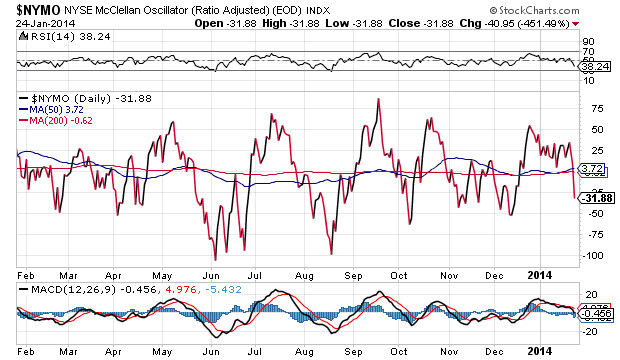
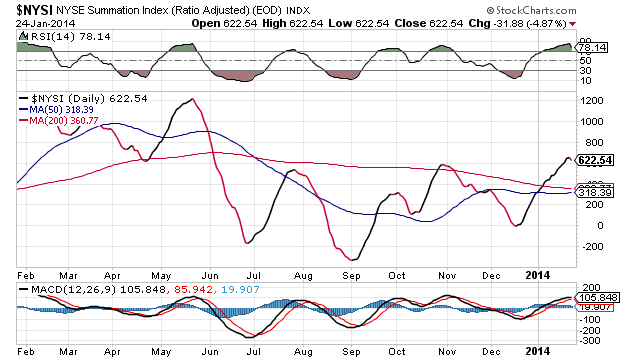
The McClellan Oscillator and Summation Index (courtesy of StockCharts.com) appear below.
After moving sideways for a couple of weeks, the McClellan Oscillator could only break out in one or two directions. Cycles suggested that it should be down, and this is what happened! It has now arrived at the level where it normally finds support - and where it probably will.
The Summation Index has just started to tick down, as did its RSI which had become very overbought. Since the latter tends to move regularly from overbought to oversold, this is probably what it is getting ready to do, especially since this is what the cyclical configuration is suggesting.
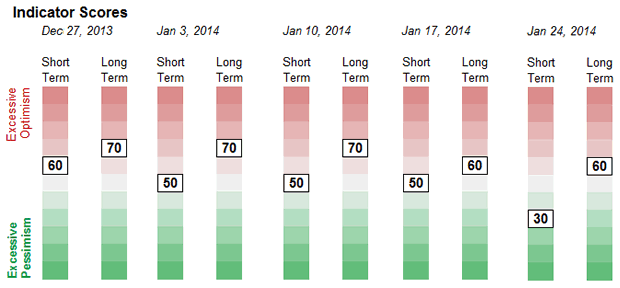
Sentiment Indicators
A 70 reading on the SentimenTrader (courtesy of same) long-term indicator was obviously enough to warn of an intermediate top, but this is not a precise timing indicator. The reading will now have to drop to 50 or below to warn of an end to the intermediate decline. For now, the short-term reading of 30 is suggesting - as are other indicators -- that the decline should soon come to a temporary halt.
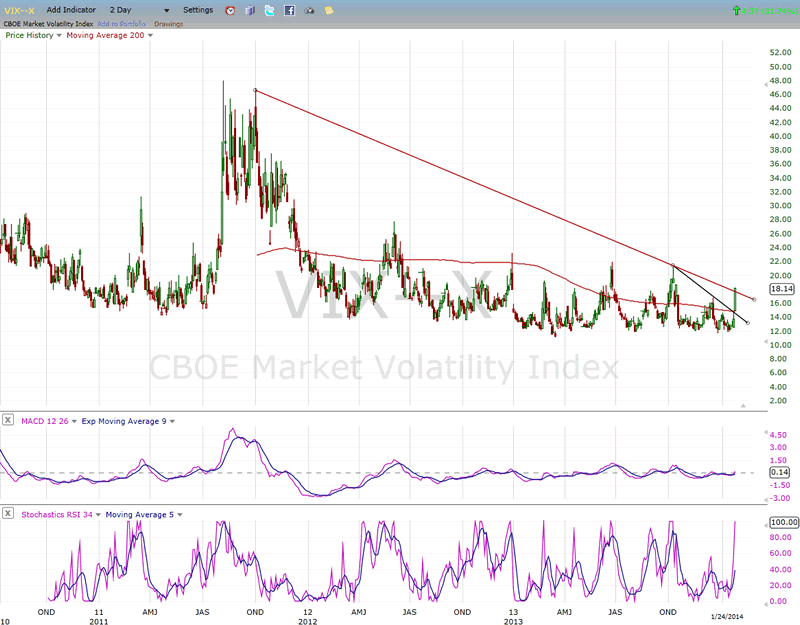
VIX (Velocity Index)
With the market decline, VIX has awakened and overcome its previous short-term top as well as the 200-DMA. The move has been arrested by a longer trend line. At the recent low, VIX did not have much predictive value -- much the same as RUT and NDX. Although there were certainly other warnings, there was still an element of stealth to this top.
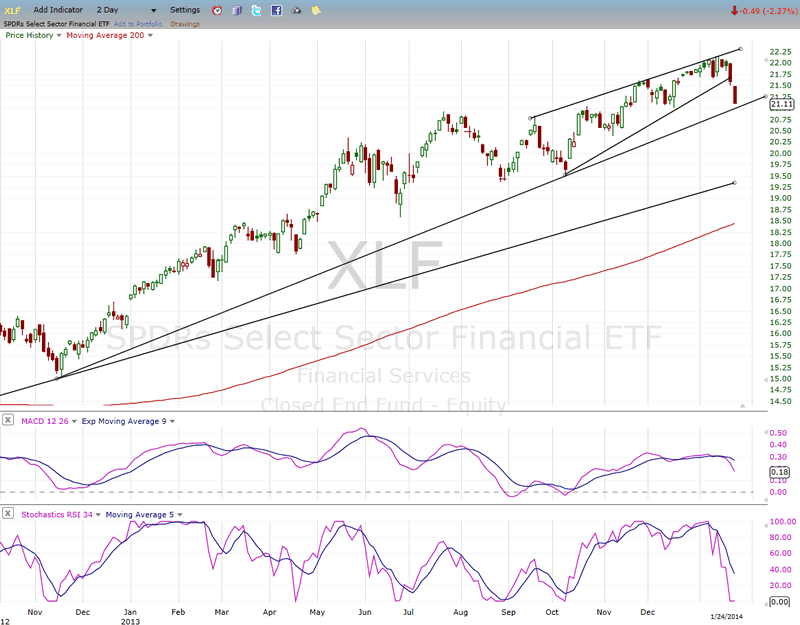
XLF (Financial Index)
XLF and the DOW industrials did weaken a couple of days ahead of SPX and warned of an impending correction, but this was offset by others which should have, and did not. XLF is now challenging its 200-DMA and continues to be relatively weaker than other indices. This adds to the notion that we have started something more than a short-term decline.
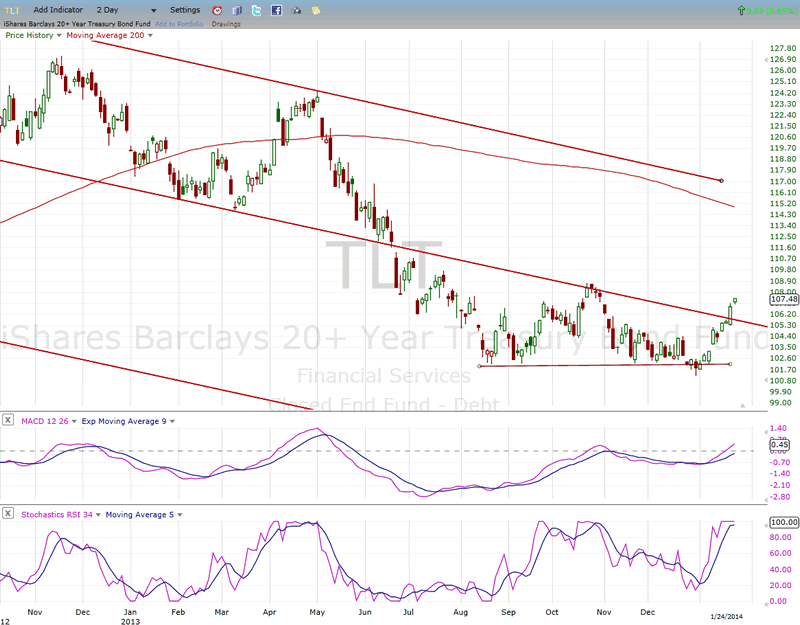
TLT (Barclays 20+ year Treasury bond fund)
As is normally the case, TLT has gone against the decline and started an uptrend. If it can move above its recent short-term high of 108, it could continue until it meets resistance at 112-113.
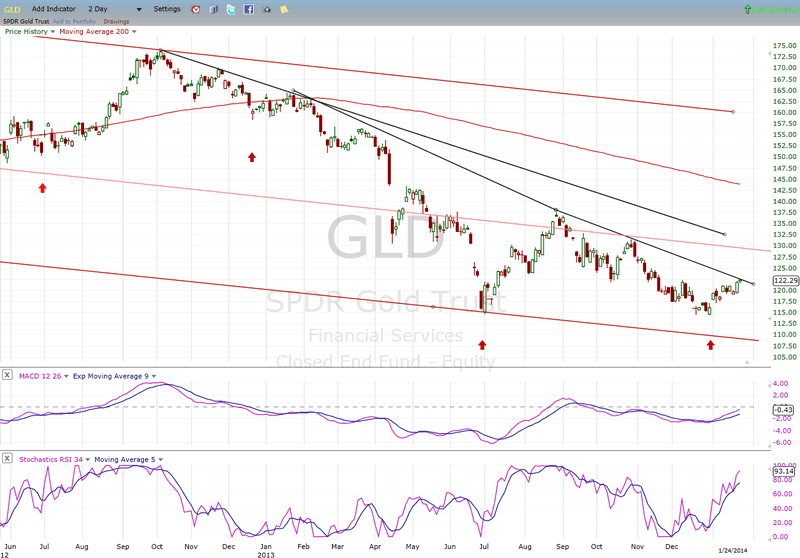
GLD (ETF for gold)
In spite of the upward lift it is now getting from the intermediate cycle, GLD has not attracted aggressive buying and still looks sluggish. This could be temporary but, although it has the potential to move up to about 135, it may have to wait until the next phase of the cycle to prove that it has started an important move.
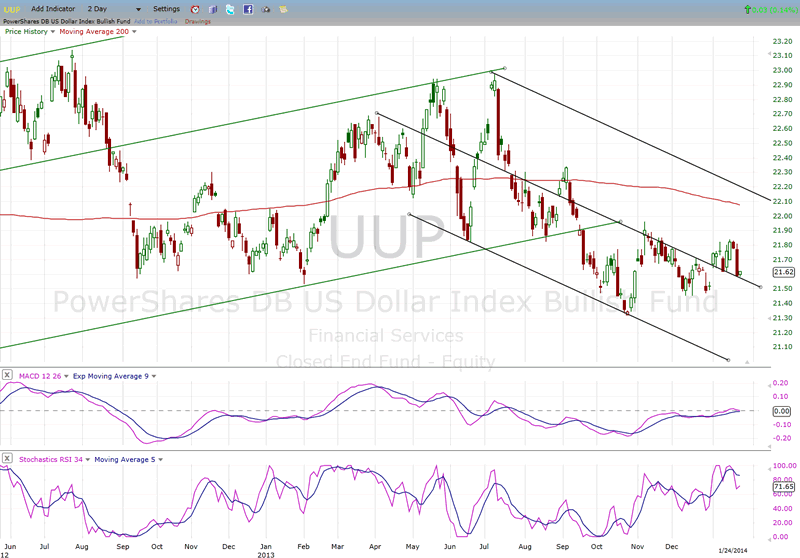
UUP (dollar ETF)
UUP continues to tread water just below an area of important resistance. This creates some uncertainty about whether or not it is ready to move out of its corrective channel. Until this is resolved, there is the possibility that it could resume its decline and make a new intermediate low.
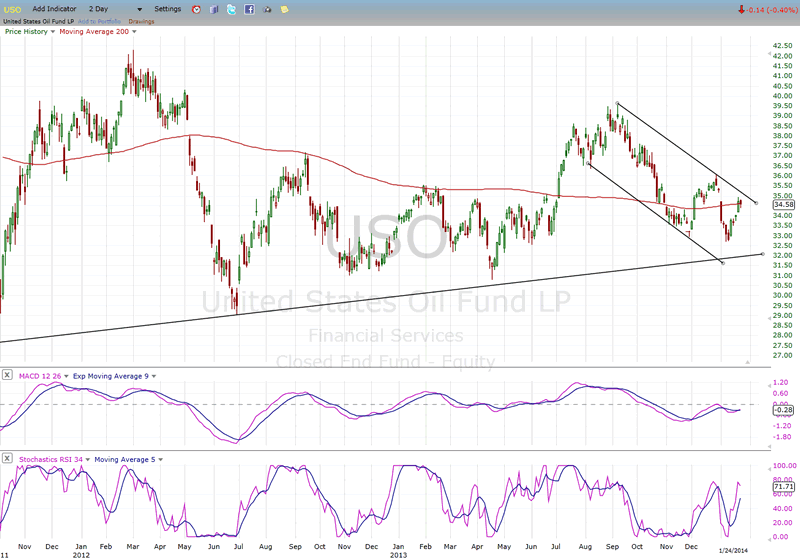
USO (United States Oil Fund)
USO continues to be in a precarious position, just holding above a 5-yr trend line. Until we see more strength develop, the odds are that it will eventually break it. Right now, it is at an important short-term juncture, having held the level of its recent low and rallied to the 200-DMA and short-term downtrend line. Moving through both would signal another attempt at establishing an uptrend.
Summary
After an important distribution phase-- which took only three weeks, but looks much longer on the P&F chart -- SPX has broken down and started the intermediate decline that we had anticipated based on the current cyclical configuration and other technical factors.
The cycles inform us that this downtrend could continue until late February. The extent of the Point & Figure formation warns us that, price-wise, we could only be at the halfway point of the correction.
FREE TRIAL SUBSCRIPTON
If precision in market timing for all time framesis something that you find important, you should
Consider taking a trial subscription to my service. It is free, and you will have four weeks to evaluate its worth. It embodies many years of research with the eventual goal of understanding as perfectly as possible how the market functions. I believe that I have achieved this goal.
For a FREE 4-week trial, Send an email to: ajg@cybertrails.com
For further subscription options, payment plans, and for important general information, I encourage
you to visit my website at www.marketurningpoints.com. It contains summaries of my background, my
investment and trading strategies, and my unique method of intra-day communication with
subscribers. I have also started an archive of former newsletters so that you can not only evaluate past performance, but also be aware of the increasing accuracy of forecasts.
Disclaimer - The above comments about the financial markets are based purely on what I consider to be sound technical analysis principles uncompromised by fundamental considerations. They represent my own opinion and are not meant to be construed as trading or investment advice, but are offered as an analytical point of view which might be of interest to those who follow stock market cycles and technical analysis.
Andre Gratian Archive |
© 2005-2022 http://www.MarketOracle.co.uk - The Market Oracle is a FREE Daily Financial Markets Analysis & Forecasting online publication.