


Weak U.S. Housing Data Supports Euro
Currencies / Forex Trading Apr 24, 2014 - 04:04 AM GMTBy: Nadia_Simmons

 Earlier today, the common currency moved higher against the U.S. dollar after data showed that the euro zone manufacturing PMI rose to 53.3 in April from 53.0 in the previous month (while analysts had expected an unchanged reading). Later in the day, the Commerce Department showed that sales on new homes dropped 14.5%, which supported the euro as well. Whether these positive numbers are in line with the technical picture of EUR/USD?
In our opinion, the following forex trading positions are justified - summary:
EUR/USD: none GBP/USD: short (stop-loss order: 1.6855) USD/JPY: none USD/CAD: none USD/CHF: none AUD/USD: none
EUR/USD
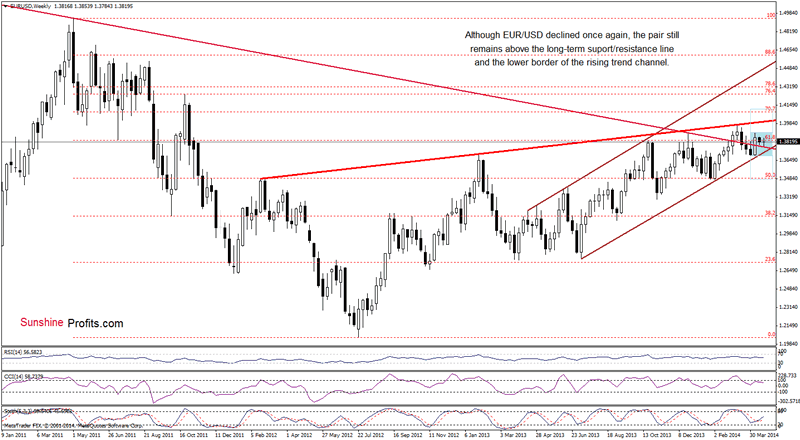
From the weekly perspective, we see that the situation hasn't changed much. So, what we wrote yesterday is still up-to-date.
(...) EUR/USD remains in a consolidation (marked with light blue). If the proximity to the previously-broken long-term declining line encourages buyers to act, we will likely see an increase to the upper border of the consolidation (at 1.3905). However, if this important support line is broken, we may see a drop to the lower border of the rising trend channel (currently around 1.3728).
Once we know the above, let's take a look at the daily chart.
Quoting yesterday's Forex Trading Alert:
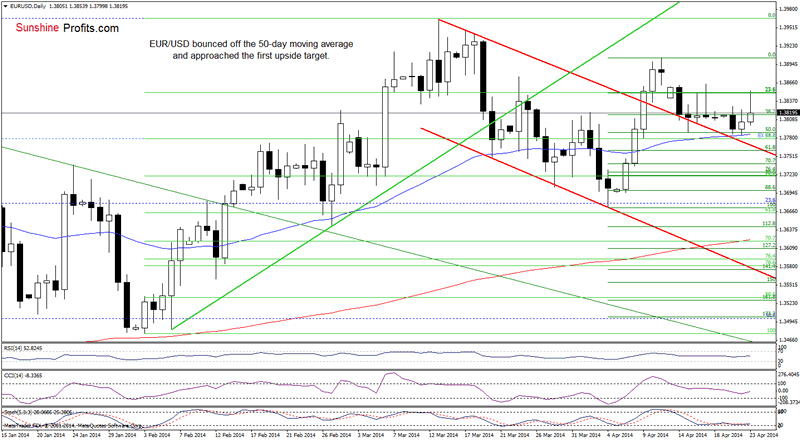
(...) EUR/USD (...) reached the 50-day moving average, which serves as support at the moment. If this line encourages buyers to act, we may see an increase to yesterday's high of 1.3830 or even to the April 17 high (1.3864).
From the daily perspective, we see that the buyers successfully pushed the exchange rate higher and approached the second upside target. This is a positive signal - especially when we factor in the position of the indicators (the CCI and RSI reversed, while the Stochastic Oscillator is oversold). If the pair moves above the April 17 high, we will likely see an increase to the April high (1.3905). Nevertheless, if the resistance level holds, we may see a test of the strength of the 50-day moving average (which remains the nearest support).
Very short-term outlook: mixed Short-term outlook: mixed MT outlook: bearish LT outlook: bearish
Trading position (short-term): In our opinion no positions are justified from the risk/reward perspective at the moment.
GBP/USD
Yesterday, we wrote:
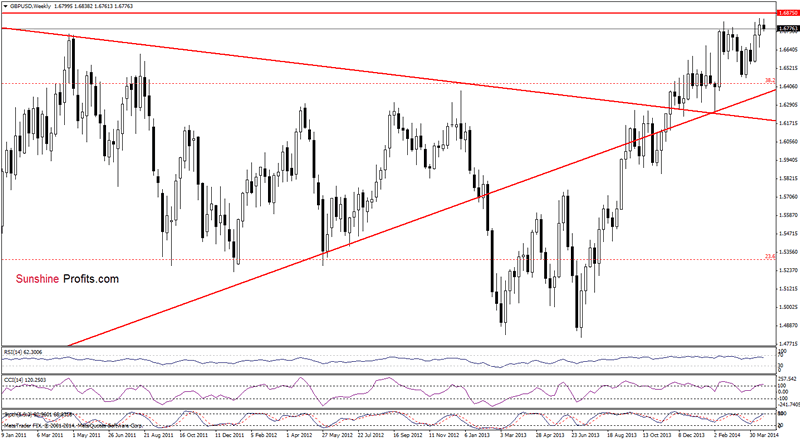
(...) the exchange rate still remains below the strong resistance zone created by Aug. and Nov. 2009 highs, which may pause or even stop further improvement. Taking this fact into account, another attempt to move lower should not surprise us.
On the above chart, we see that the proximity to this resistance zone encouraged sellers to act, which resulted in a downswing. From this perspective it seems that further deterioration is just around the corner.
To have more complete picture of the current situation in GBP/USD, let's take a look at the daily chart.
Quoting our last Forex Trading Alert:
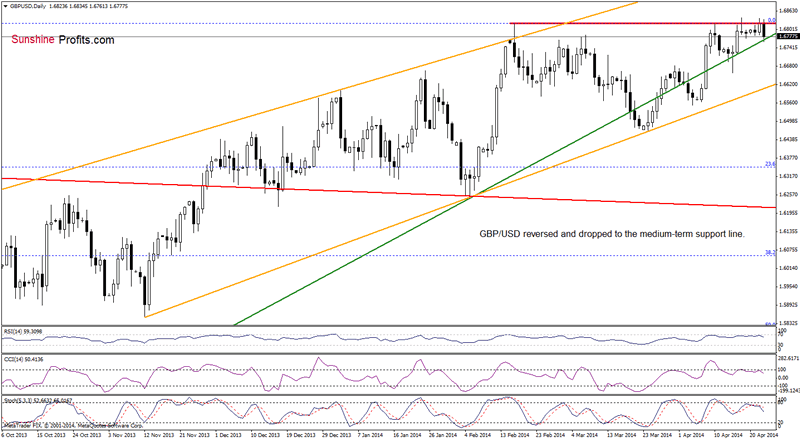
(...) GBP/USD (...) almost touched the 2014 high (...) if this resistance level encourages sellers to act, we will likely see another try to break below the green medium-term line (currently around 1.6755), which serves as major support at the moment.
Looking at the above chart, we see that the exchange rate reversed and declined to the green medium-term line earlier today. If this strong support holds, we may see a corrective upswing to the annual high. However, if it is broken, we will likely see a bigger decline and the initial downside target will be around 1.6659, where the Apr.15 low is. Please note that the current position of the indicators (all indictors generated sell signals) favors sellers.
The probability for the decline is not huge, but if it happens, then the following decline is likely to be significant. That's why we think the short positions are still justified.
Very short-term outlook: bearish Short-term outlook: bearish MT outlook: bearish LT outlook: mixed
Trading position (short-term; our opinion): Short. Stop-loss order: 1.6855. Please note that if the pair moves above our stop-loss level, it seems that it will rally some more before heading south once again. If this is the case, we'll consider re-opening short positions around the 2009 high.
USD/JPY
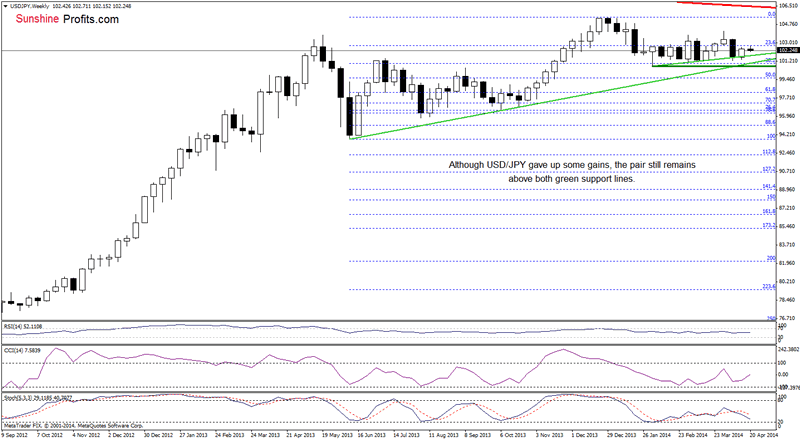
From the weekly perspective, we see that although USD/JPY gave up some gains, the overall situation hasn't changed much as the exchange rate remains above both green support lines.
Is the short-term outlook also bullish? Let's take a look at the daily chart.
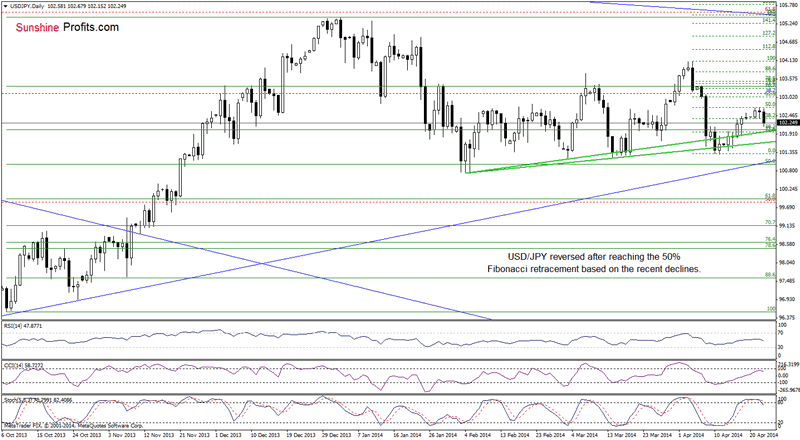
In our last Forex Trading Alert, we wrote the following:
(...) the initial upside target will be around 102.70, where the 50% Fibonacci retracement based on the recent decline is.(...) If this resistance level holds, we may see a pullback to the upper green support line (currently around 101.96).
On the above chart, we see that the exchange rate reversed and declined sharply earlier today. With this downswing, USD/JPY declined below yesterday's low and, taking into account the current position of the indicators (the CCI and Stochastic Oscillator generated sell signals), it seems that the sellers will realize this bearish scenario in the coming day (or days). Please note that if this support line is broken, we will likely see a drop to the lower green line (currently around 101.67).
Very short-term outlook: bearish Short-term outlook: mixed with bearish bias MT outlook: bullish LT outlook: bearish
Trading position (short-term): In our opinion no positions are justified from the risk/reward perspective at the moment.
USD/CAD
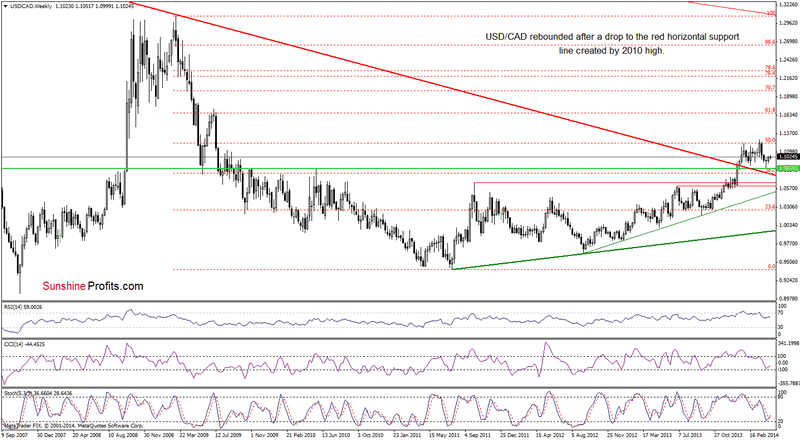
Looking at USD/CAD from the weekly perspective, we see that the situation hasn't changed. So, what we wrote in our previous Forex Trading Alert is still valid.
(...) although the exchange rate declined in the previous weeks, it still remains above the previously-broken long term declining support/resistance line (marked with red). With this downward move, the pair declined to the horizontal green support line (created by the 2010 high) and rebounded. Nevertheless, the size of the corrective upswing is still quite small, which suggests that another attempt to move lower can't be ruled out.
Before we summarize this currency pair, let's move on to the daily chart.
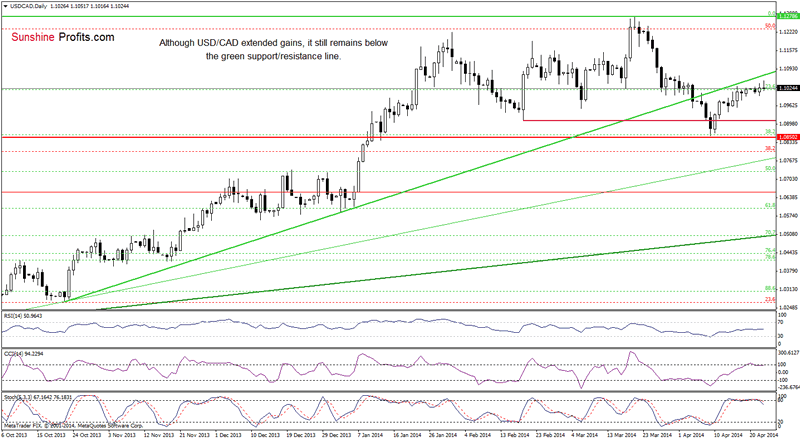
Yesterday, we wrote the following:
(...) USD/CAD (...) came back to a consolidation between Wednesday high and low. On one hand, if USD/CAD moves above 1.1032, we may see another attempt to break above the green resistance line. On the other hand, if the buyers fail, we will likely see a pullback to around 1.0982 (the April 17 low) or even to 1.0958, where the lower border of the consolidation is.
As you see on the above chart, although the buyers pushed the exchange rate higher, the pair still remains below the green resistance line. Additionally, USD/CAD reversed and came back to the consolidation range once again. Similarly to what we wrote yesterday, we may see another try to move higher. However, taking into account the current position of the indicators (the CCI and Stochastic Oscillator generated sell signals earlier today), it seems that a correction in the coming days is more likely. If this is the case, downside targets from our previous Forex Trading alert, will be in play.
Very short-term outlook: mixed with bearish bias Short-term outlook: mixed with bearish bias MT outlook: bullish LT outlook: bearish
Trading position (short-term): In our opinion no positions are justified from the risk/reward perspective at the moment.
USD/CHF
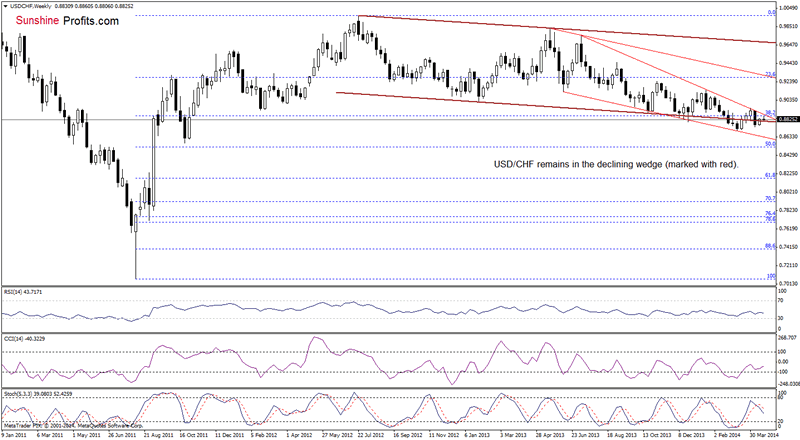
From this perspective, we see that the situation has deteriorated slightly as the exchange rate gave up some gains. If the proximity to the upper border of the declining wedge encourages sellers to act, we may see further deterioration and a drop to the lower line of the declining trend channel (marked with brown) - currently around 0.8800.
Once we know the above, let's take a closer look at the daily chart.
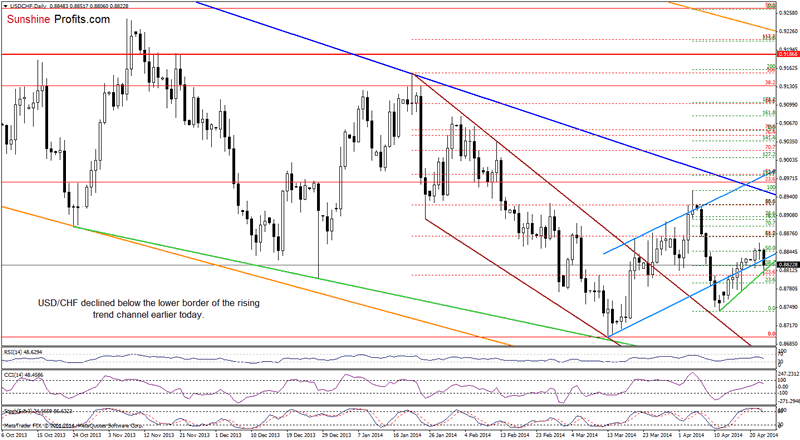
As you see on the above chart, the situation has deteriorated as USD/CHF reversed and declined below the lower border of the blue rising trend channel. With this move, the exchange rate dropped to the very short-term support line based on Apr.11 and Apr.17 lows. If this line holds, we may see a corrective upswing and an increase to around yesterday's high. However, if the sellers do not give up and push the pair lower, we may see a decline to the Apr.17 low or even to the monthly low of 0.8742.
Very short-term outlook: mixed Short-term outlook: mixed MT outlook: bearish LT outlook: bearish
Trading position (short-term): In our opinion no positions are justified from the risk/reward perspective at the moment.
AUD/USD
In our last Forex Trading Alert, we wrote the following:
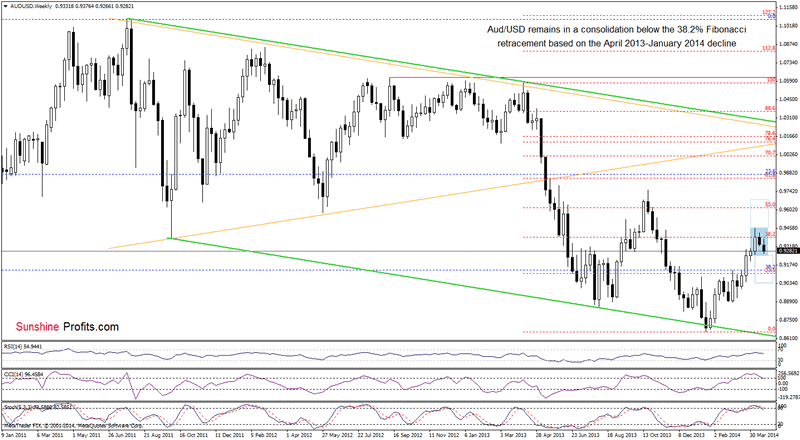
(...) AUD/USD (...) remains in a consolidation (marked with light blue) around the 38.2% Fibonacci retracement based on the entire Apr.2013-Jan.2014 decline (0.9389). (...) if the buyers do not give up, we may see further improvement and an increase to the April high. However, if they fail and the pair extends declines, we may see a correction to around 0.9253, where the lower border of the consolidation is. Please note that the CCI and Stochastic Oscillator are overbought (and very close to generating sell signals), which suggests that another attempt to move lower should not surprise us.
As you see on the weekly chart, the exchange rate extended losses and approached the first downside target. If the support level holds and encourages buyers to act, we may see an increase to the 38.2% Fibonacci retracement. However, if the lower border of the consolidation is broken, we may see further deterioration and a drop to around 0.9046 (at this level the size of the downswing corresponds to the height of the consolidation range). From this perspective, we also see that the CCI and Stochastic Oscillator generated sell signals, which may trigger further declines.
Once we know the medium-term situation, let's move on to the daily chart.
Quoting our previous Forex Trading Alert:
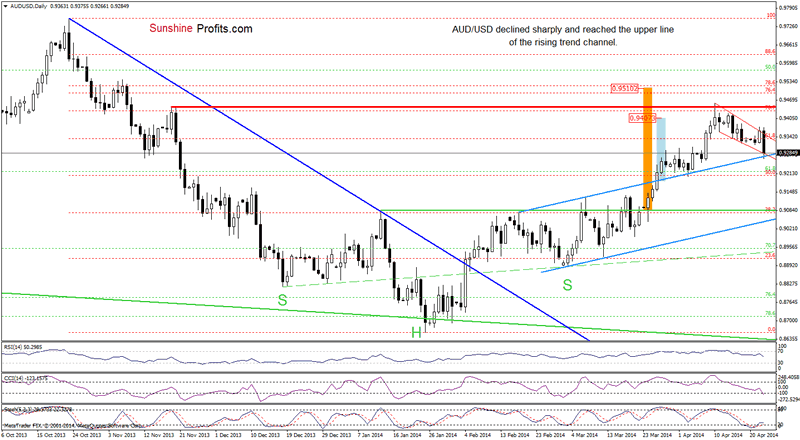
(...) AUD/USD rebounded and broke (very temporarily) above the upper line of the declining trend channel (...). If this resistance line holds, we will likely see a pullback to Monday low, or even to the lower border of this formation (currently around 0.9291). At this point, it's worth noting that not far above this line is Thursday high, which serves as an additional resistance (0.9389).
Looking at the above chart, we see that the sellers realized this bearish scenario earlier today. With today's downswing, the pair not only dropped below the lower border of the declining trend channel, but also reached the upper line of the blue rising trend channel. If the combination of these two support lines encourages buyers to push the exchange rate higher, we may see another attempt to break above the red declining resistance line. However, if this strong support area is broken, the initial downside target will be around 0.9204, where the Apr.3 low is.
Very short-term outlook: mixed with bearish bias Short-term outlook: mixed with bearish bias MT outlook: bearish LT outlook: bearish
Trading position (short-term): In our opinion no positions are justified from the risk/reward perspective at the moment.
Thank you.
Nadia Simmons
Sunshine Profits‘ Contributing Author
Oil Investment Updates
Oil Trading Alerts
* * * * *
Disclaimer
All essays, research and information found above represent analyses and opinions of Nadia Simmons and Sunshine Profits' associates only. As such, it may prove wrong and be a subject to change without notice. Opinions and analyses were based on data available to authors of respective essays at the time of writing. Although the information provided above is based on careful research and sources that are believed to be accurate, Nadia Simmons and his associates do not guarantee the accuracy or thoroughness of the data or information reported. The opinions published above are neither an offer nor a recommendation to purchase or sell any securities. Nadia Simmons is not a Registered Securities Advisor. By reading Nadia Simmons’ reports you fully agree that he will not be held responsible or liable for any decisions you make regarding any information provided in these reports. Investing, trading and speculation in any financial markets may involve high risk of loss. Nadia Simmons, Sunshine Profits' employees and affiliates as well as members of their families may have a short or long position in any securities, including those mentioned in any of the reports or essays, and may make additional purchases and/or sales of those securities without notice.
© 2005-2022 http://www.MarketOracle.co.uk - The Market Oracle is a FREE Daily Financial Markets Analysis & Forecasting online publication.