


EUR/USD – Currency Bears in Charge
Currencies / Forex Trading May 15, 2014 - 08:00 PM GMTBy: Nadia_Simmons

 Earlier today, the combination of positive economic indicators in the U.S. pushed the euro to a 11-week low against the greenback. Thanks to this news, EUR/USD slipped to important support levels. Will they withstand the selling pressure and trigger a corrective upswing in the following days? Or maybe today’s show of weakness means that the worst for the common currency is not behind us?
In our opinion, the following forex trading positions are justified - summary:
EUR/USD: short (stop-loss order: 1.4040)
GBP/USD: none
USD/JPY: none
USD/CAD: none
USD/CHF: none
AUD/USD: short (stop-loss order: 0.9410)
EUR/USD
Yesterday, we wrote the following:
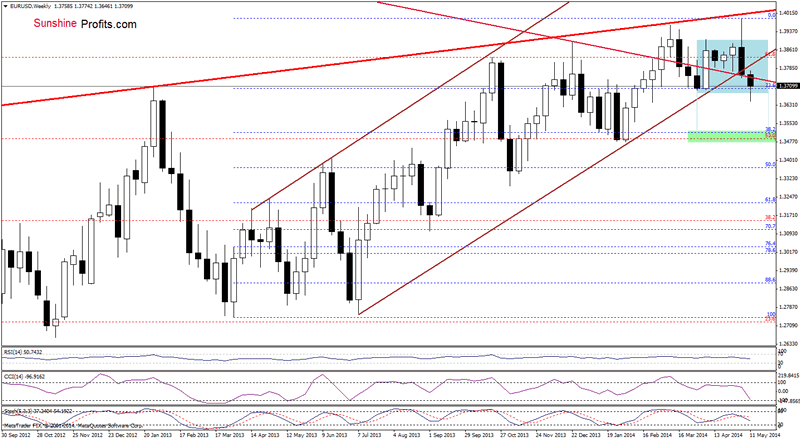
(…) the exchange rate is currently trading slightly above the lower border of the consolidation. Will this support level be strong enough to withstand the selling pressure? In the very short term it may decelerate (or even pause) further deterioration. However, in a broader time perspective, we think that the breakdown below the long-term support line will be more important for forex traders . Why? Because although we saw similar price action in March, this time EUR/USD hasn’t got support from the lower border of the rising trend channel. To us, this is a strong bearish factor that signifies that further deterioration is just around the corner.
From this perspective, we see that the situation has deteriorated once again as EUR/USD dropped below the lower border of the consolidation range. In our opinion, if the breakdown below this support/resistance line is not invalidated, the exchange rate will extend losses in the coming week (or weeks). In this case, the downside target will be around 1.3516 (where the 38.2% Fibonacci retracement based on the entire March 2013-May 2014 is) or even slightly lower – around 1.3480, where the bottom of the previous bigger correction (between Dec. and Feb.) is .
Having discussed the above, let’s focus on the short-term perspective.
Quoting our last Forex Trading Alert:
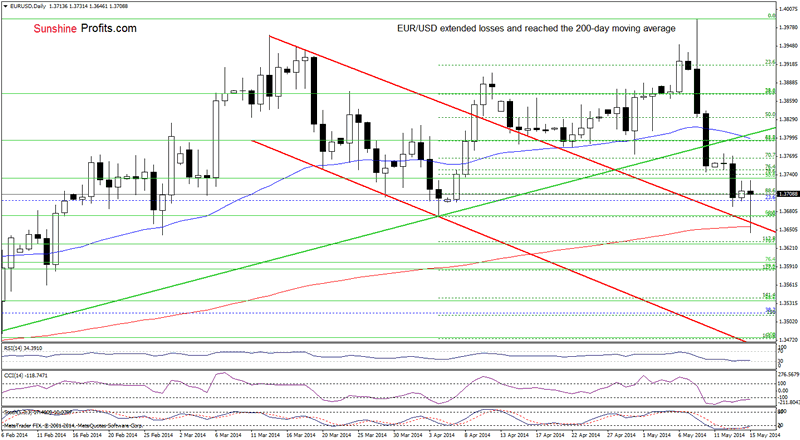
(…) this upswing is too small to change not only the short-term outlook, but also the very short-term picture, which remains bearish. Therefore, another attempt to move lower is still likely. If this is the case, we are convinced that the next downside target will be the upper line of the declining trend channel, which currently intersects the 61.8% Fibonacci retracement (based on the entire Feb-May rally).
As you see on the daily chart, EUR/USD reached the above-mentioned downside target, slipping to the 200-day moving average at the same time. The combination of these two strong supports triggered a corrective upswing, which took the exchange rate to yesterday’s price levels. Additionally, there are positive divergences between the CCI, Stochastic Oscillator and the exchange rate, which suggests that we may see further improvement in the near future (especially if the indicators generate buy signals). If this is the case, EUR/USD will likely move to around 1.3770 (this week’s high is) or even to 1.3800, where the 50-day moving average and the previously-broken medium-term green line are.
Taking all the above into account, some of you may want to close short positions and take profits off the table, and we are perfectly fine with that, however, we prefer to focus on the bigger move that will probably follow shortly - we don't want to risk missing it.
In our opinion, the breakout in the USD Index above the medium-term resistance line can trigger a significant rally soon - even without the above-mentioned correction. Therefore, we remain bearish on EUR/USD.
Very short-term outlook: bearish
Short-term outlook: bearish
MT outlook: bearish
LT outlook: bearish
Trading position (short-term): Short. Stop-loss order: 1.4040.
USD/CHF
In our Forex Trading Alert posted on May 9, we wrote the following:
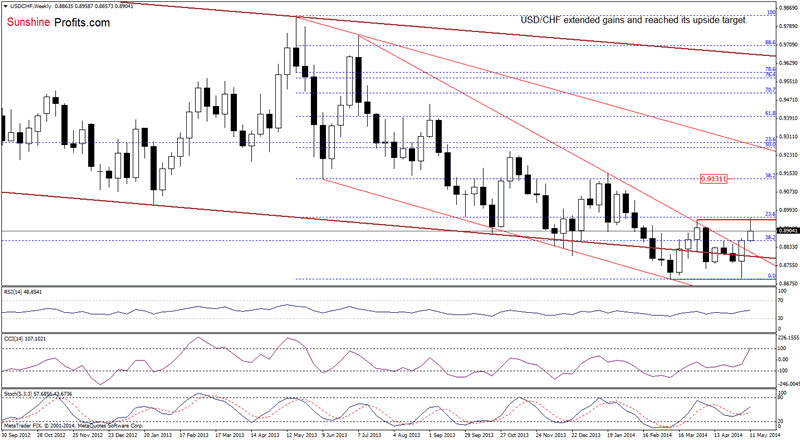
(…) the support level withstood the selling pressure, which resulted in a sharp corrective upswing that took USD/CHF above the upper border of the declining wedge. Although the breakout above this resistance line is not confirmed at the moment, we think that this is a strong bullish signal and further improvement is likely to be seen. In our opinion, if the breakout is not invalidated, the exchange rate may extend rally to around the April high of 0.8922.
On the weekly chart, we clearly see that the exchange rate realized the above-mentioned bullish scenario. Therefore, taking into account the resistance level we should consider two scenarios. On one hand, if USD/CAD breaks above the April high (which is currently reinforced by the 23.6% Fiboncci retracement based on the entire May-March deline), we may see further improvement and an increase to around 0.9131, where the 38.2% Fibonacci retracement is. On the other hand, if this area encourage forex traders to push the sell button, we will see a pullback to around last week’s high of 0.8872, which seves as the nearest support. At this point, we would like to draw your attention to the fact that traders who had bet on higher values may lock in their profits in this area, which will likely raise the selling pressure and push the exchange rate lower.
Will the short-term chart give us any clues about future moves? Let’s check.
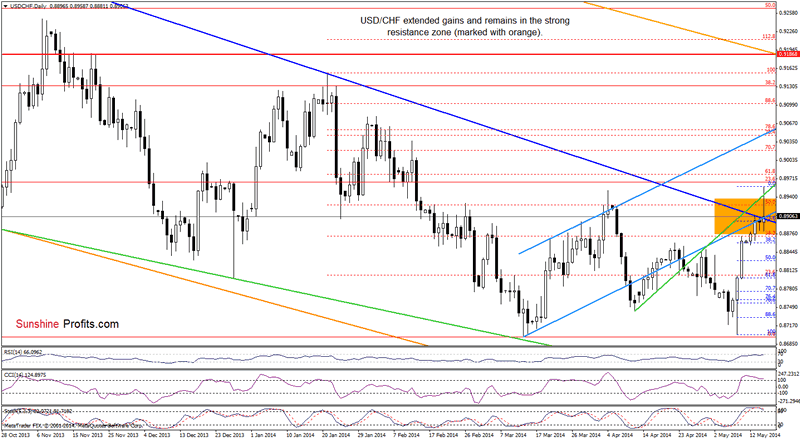
Looking at the above chart, we see that the pair shot up and broke above the resistance zone, reaching April high. Although this was a strong bullish signal, USD/CHF reversed and declined sharply below all resistance lines. An invalidation of the breakout in combination with an elongate upper shadow of today’s candlestick, provide us with bearish implications and suggests that selling pressure may increase in the near future. In our opinion, if the exchange rate closes the day below the medium-term declining blue line and the lower border of the rising trend channel, we will likely see a pullback to around 0.8860, where the 38.2% Fibonacci retracement based on the recent rally is.
Finishing our commentary on this currency pair, we would like to draw your attention to the position of the indicators that we discussed yesterday:
(…) the RSI climbed its highest level since April peak. Back then, such high reading of the indicator preceded a bigger correction. Therefore, if history repeats itself, we’ll see USD/CHF lower. Additionally, there is a negative divergence between the CCI and the exchange rate, which reinforce the bearish scenario.
Very short-term outlook: bearish
Short-term outlook: mixed
MT outlook: mixed with bullish bias
LT outlook: bearish
Trading position (short-term): In our opinion no positions are justified from the risk/reward perspective.
AUD/USD
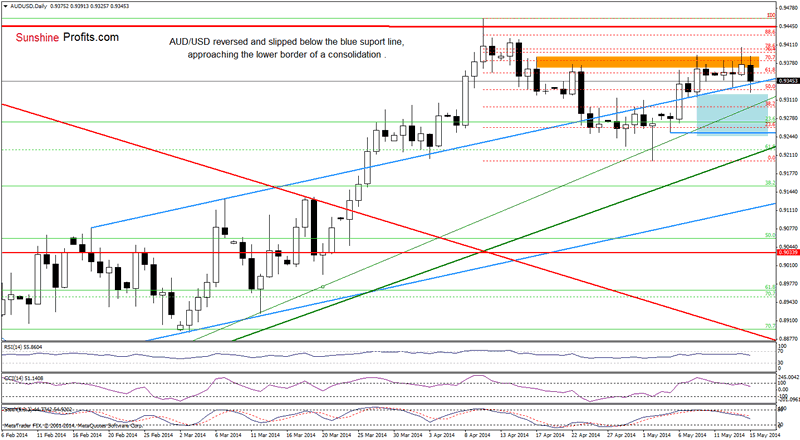
The overall situation in the medium term hasn’t changed much as the exchange rate still remains in the consolidation range above the support line. Today, we’ll focus only on the very short-term changes.
Yesterday, we wrote the following:
(…) In our opinion, there are a number of signs that a pullback in AUD/USD is close. First, the exchange rate reached the next resistance zone created by the 76.4% and 78.6% Fibonacci retracement levels (based on the entire recent decline). From our experience, this area usually stops (or at least decelerates) further improvement. Secondly, when we take a closer look at the daily chart, we notice a 5-wave sequence, which suggests that the correction is likely to be seen. Another negative signs come from the indicators. As you see, the RSI remains at its highest level since April high, while the CCI and Stochastic Oscillator generated sell signals. Additionally, there are negative divergences between them and the exchange rate, which increases the risk of trend reversal.
As you see on the daily chart, AUD/USD reversed and declined below the blue rising support line. Although this drop was only temporarily, all the above-mentioned bearish factors remain in place, which suggests that it may take some time before a breakout higher becomes likely. Therefore, we remain convinced that further deterioration is just around the corner and the current correction will accelerate if the exchange rate drops below the lower border of the consolidation (based on the May 8 low of 0.9318).
Very short-term outlook: bearish
Short-term outlook: bearish
MT outlook: bearish
LT outlook: bearish
Trading position (short-term): Short. Stop-loss order: 0.9410.
Thank you.
Nadia Simmons
Sunshine Profits‘ Contributing Author
Oil Investment Updates
Oil Trading Alerts
* * * * *
Disclaimer
All essays, research and information found above represent analyses and opinions of Nadia Simmons and Sunshine Profits' associates only. As such, it may prove wrong and be a subject to change without notice. Opinions and analyses were based on data available to authors of respective essays at the time of writing. Although the information provided above is based on careful research and sources that are believed to be accurate, Nadia Simmons and his associates do not guarantee the accuracy or thoroughness of the data or information reported. The opinions published above are neither an offer nor a recommendation to purchase or sell any securities. Nadia Simmons is not a Registered Securities Advisor. By reading Nadia Simmons’ reports you fully agree that he will not be held responsible or liable for any decisions you make regarding any information provided in these reports. Investing, trading and speculation in any financial markets may involve high risk of loss. Nadia Simmons, Sunshine Profits' employees and affiliates as well as members of their families may have a short or long position in any securities, including those mentioned in any of the reports or essays, and may make additional purchases and/or sales of those securities without notice.
© 2005-2022 http://www.MarketOracle.co.uk - The Market Oracle is a FREE Daily Financial Markets Analysis & Forecasting online publication.