


Lowest Interest Rates in 500 Years, Oil Shortages in 10 Years
Interest-Rates / Financial Markets 2014 Jul 01, 2014 - 03:20 PM GMTBy: Raul_I_Meijer

 We all know that interest rates are at an ultra low level, whether it’s the rate on our savings accounts, our mortgages (though those are quite a bit higher, quelle surprise), central bank rates or yields on government bonds. All this, plus a watershed of global QEs, have led to stock exchanges at highs that have nothing at all to do anymore with the performance of the real economies they’re supposed to represent – and historically did.
Add to that that on stock exchanges, trading volumes are as ultra low as interest rates are, and from what trading is left, a substantial part is machines, i.e. high frequency, and we have a pretty clear idea of just how distorted our picture of our economies have become. We no longer have a clue what really happens, since we don’t know what is worth what. Share prices tell us nothing about a company’s performance, since any strength that is does appear to have left may as well stem from cheap credit borrowed at those same ultra low rates and used for stock buybacks and other purely financial moves.
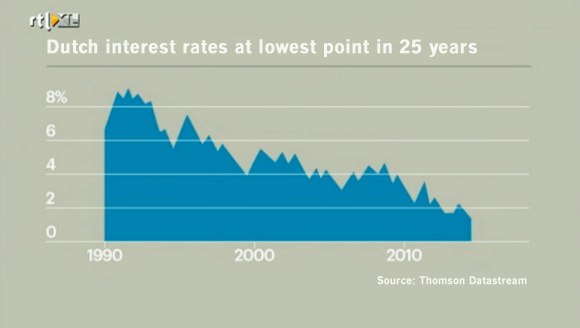
Still, wouldn’t it be nice to know, from a historical perspective, exactly how low have interest rates become? I saw a nice example today on Dutch business channel RTL-Z. The yield on the 10-year bond in Holland was 1.476% today. Which is not just the lowest the Dutch paid in the past 25 years:
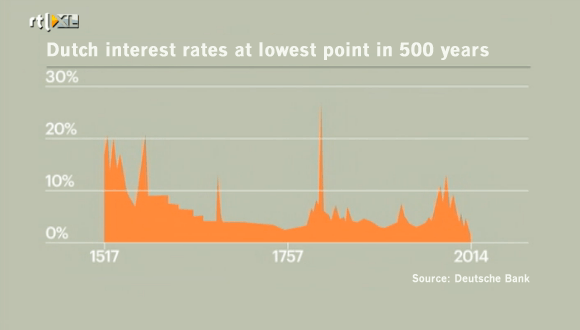
But even in the past 500 years:
You wouldn’t even expect to see such rates in even the most buzzing or otherwise extreme economies, let alone in one that’s as anemic, other than in stock markets, as ours are today. To wit: purchasing managers indices (PMIs) in Europe all fell again today. Perhaps we need to recognize that today’s economy is indeed a very extreme one.
And if you get the feeling from what’s going on that in order for the central banks to be able put lipstick on their pig, they have to kill it in the process, you’re not far off at all. They’ve largely killed bond markets, and not much is left of equity either, as we saw yesterday. The only thing that keeps the zombie pig going is debt, and more debt.
But we shouldn’t forget that the financial world, which can be made to – seem to – show “healthy” growth this way, demands more growth each year, that it’s an exponential growth rate we’re talking about. And that, even central banks cannot deliver. Not for long.
I had an email exchange with Jeffrey Brown recently, since I wondered if he had updates available on his Export Land Model, which deals with declining amounts of oil available for export from oil producing countries, because of depletion rates and relentlessly rising domestic consumption. Jeffrey’s a longtime – and very smart – oil geologist also known as Westexas whom we know from our Oil Drum days. I couldn’t figure out a good way to write up what he sent me back then, but I’ll give it a shot after seeing something he wrote the other day in reply to an article on peakoilbarrel.com, North Dakota and the Bakken by County.
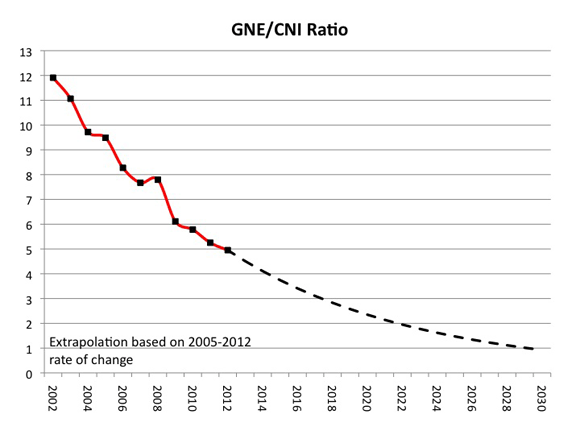
Jeffrey uses terms like Global Net Exports, Avalaible Net Exports, Cumulative Net Exports and Chindia’s Net Imports. That may look confusing at first glance, but it does make a lot of sense once you think about it. The overall idea is that even if total global oil production would not decline, an argument all too easily made by the shale faithful, oil available for sale in global markets would still fall rapidly, because of those domestic consumption numbers (oil producing countries grow both their economies and populations) and because of the surging demand from the 2.5 billion people living in China and India. This is how he puts – part of – the overall picture:
Of course, the really crazy low number is my estimate for the remaining volume of Available CNE (Cumulative Net Exports), i.e., the estimated cumulative remaining volume of GNE (Global Net Exports) available to importers other than China & India.
Available Net Exports (ANE), or GNE less CNI (Chindia’s Net Imports), were 41 mbpd in 2005 (or 15 Gb/year). Based on the 2005 to 2012 rate of decline in the GNE/CNI Ratio, I estimate that post-2005 Available CNE are on the order of about 170 Gb. At the 2005 rate of consumption in ANE, estimated post-2005 Available CNE would be depleted in about 12 years (analogous to a Reserve/Production Ratio).
From 2006 to 2012, cumulative ANE were about 95 Gb, which would put estimated remaining Available CNE at about 75 Gb at the end of 2012. At the 2012 rate of consumption in ANE, estimated remaining Available CNE would be depleted in about 6 years , i.e., the total estimated volume of Global Net Exports of oil available to about 155 net oil importing countries would be totally gone in 6 years (about 2,200 days). Of course, the expectation is for an ongoing decline in ANE, and the current extrapolated data suggest that ANE would theoretically approach zero around the year 2030.
As someone once said, what can’t continue tends not to continue, and there is no way we would have a functioning global economy if two countries consumed anything close to 100% to Global Net Exports of oil, but here’s the problem: Given an inevitable ongoing decline in GNE, unless the Chindia region cuts their GNE consumption at the same rate as the rate of decline in GNE, or at a faster rate, the resulting ANE decline rate will exceed the GNE decline rate, and the ANE decline rate will accelerate with time. It’s a mathematical certainty.
In any case, the projected rate of decline in the GNE/CNI Ratio puts us at a point in 2030 at which we cannot arrive, but the 2013 data will almost certainly show that we continued to slide toward a point at which we cannot arrive:
Quite the conundrum.
What we take away from this is that China and India’s demand for oil is rising so fast, in perhaps 10 years’ time available oil in the markets will either go to them or it will go to us, but not to both. Time to prepare to fight over the stuff, and make it unavailable for the poor at the same time?!
By Raul Ilargi Meijer
Website: http://theautomaticearth.com (provides unique analysis of economics, finance, politics and social dynamics in the context of Complexity Theory)
Raul Ilargi Meijer Archive |
© 2005-2022 http://www.MarketOracle.co.uk - The Market Oracle is a FREE Daily Financial Markets Analysis & Forecasting online publication.