


Stock Market Correction Underway
Stock-Markets / Stock Markets 2015 Mar 09, 2015 - 12:21 PM GMTBy: Andre_Gratian

 Current Position of the Market
SPX: Long-term trend - Bull Market
Intermediate trend - Is the 7-yr cycle sketching an intermediate top?
Analysis of the short-term trend is done on a daily basis with the help of hourly charts. They are important adjuncts to the analysis of daily and weekly charts which ultimately indicate the course of longer market trends.
CORRECTION UNDERWAY
Market Overview
In the past couple of weeks, I mentioned that the breadth, as well as the trend, was weakening. Last week, this process accelerated and culminated with a 29-point decline for the SPX on Friday.
Now that a correction is underway, we need to determine how far it will go and how long it will last. There are several potential downward projections and on Friday, the SPX missed filling the minimum one by a couple of points. These range from a normal correction of the rally from 1980 to a re-test of that low. Each projection should bring at least a pause in the decline, followed by either a reversal of the downtrend, or a continuation of the correction.
Of the major indexes, SPX suffered the greatest loss while XBD, a favorite long-term leading index, actually made a fractional new bull market high and finished the day with a slight gain. It is interesting to note (without drawing any conclusion) that a similar behavior took place in this index as the October correction was getting started.
Since the various market components lack coherence in their performance, it is possible that we may have only started a limited correction. But it has the potential to turn out into something more severe than many expect.
Indicators survey
The weekly trend continues to be up, but the momentum oscillators turned down after making a lower high, thereby increasing their intermediate term negative divergence with price. The daily ones are in a sell mode.
Last week I mentioned that the McClellan oscillator appeared to be making a vulnerable pattern. As you can see below, this proved to be correct. By reaching a reading of -2313 on Friday, the NYSE A/Ds had their worst daily performance since last 9th of October (-2395). Nevertheless, I might point out that the index has not reached an oversold level, yet.
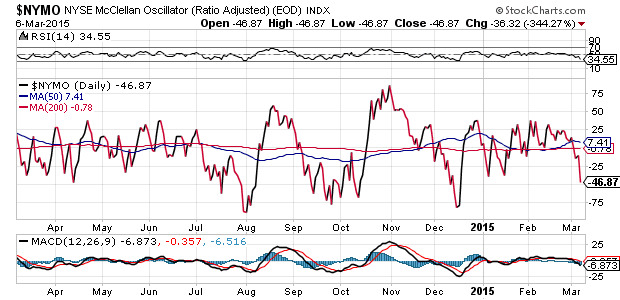
The short-term P&F chart has only used up part of its distribution potential. That makes lower prices likely -- but by no means certain.
The longer-term 3X chart may be engaged in making a large rounding top formation. Perhaps this is due to the topping of the 7-year cycle which has not quite started its declining phase, yet.
Chart Analysis
We start with the weekly SPX (chart courtesy of QCharts.com, including others below) with the McClellan Summation Index (courtesy of StockCharts.com) posted underneath it.
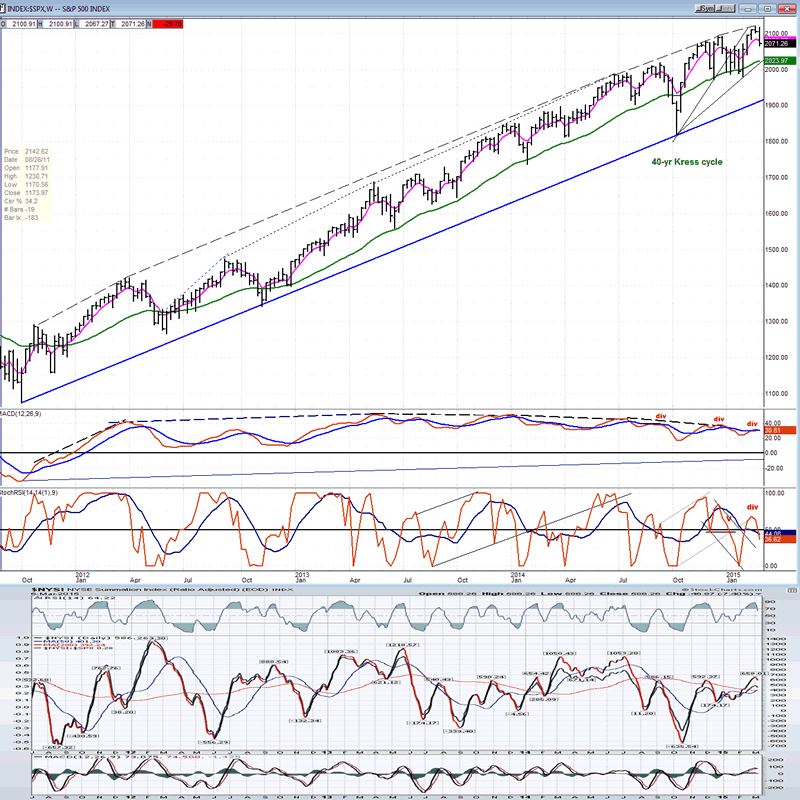
Since October 2011, the beginning of the current "intermediate" trend, weekly prices are in a very slowly decelerating phase which is much more evident in the MACD than in the price chart. I have connected the tops of both with dashed lines in order to make the process more visible. As the 7-year cycle exerts more and more down pressure in its declining phase, this process should become easier to see. Considering the path that is being described by the index, there could be one or more new highs before the cycle's apogee. If this analysis is correct, I do not see how the SPX could reach prices in the 2400s and 2600s (which are foreseen by some EW theorists) before the cycle has made its low toward the end of this year or later.
As for the immediate future, the current weakness has turned the SRSI down before it made a new high, thereby increasing is negative divergence to the price. The MACD is slower to turn over, but it should make the same pattern...and this is also what the NYSI is doing.
Unless historical precedents are useless, both the SRSI and the Summation Index RSI are just beginning to roll over and, since they tend to become oversold before the correction is over, we should be able to assume that the decline has some time to go before it is complete.
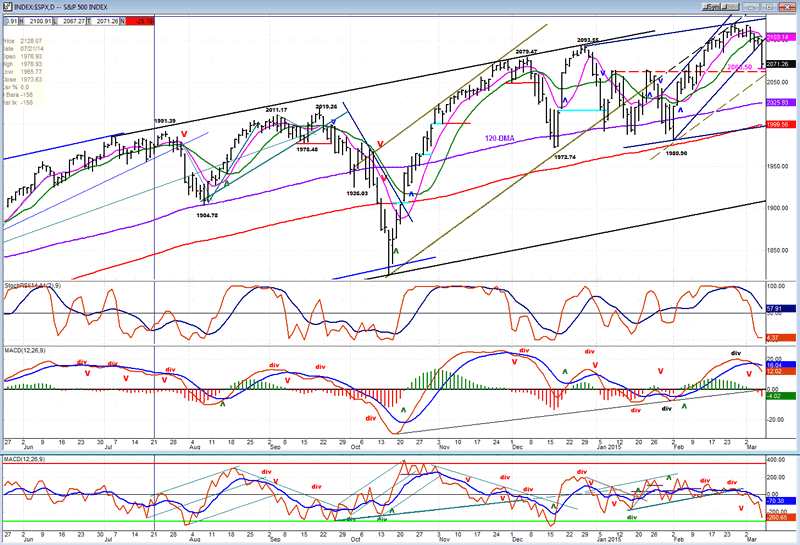
The daily chart has been slowly rolling over for the last several days, but until it came out of its channel completely, we could not say for certain that it was entering a corrective phase. The lower channel line did manage to hold the price for a couple of days, but after Friday's performance, we have more than enough confirmation.
All the oscillators have turned down sharply and, until we see them starting to turn up, we can assume that the decline is not over. The top one (SRSI) is already oversold but, as you can see on the chart, it remained at the bottom of its range for several weeks during last September-October before turning up decisively.
I have marked the first projection target of 2066.50 on the chart. It was almost reached on Friday with a low of 2067.27 and, since the market is extremely oversold on a short-term basis, and prices turned up at the close, it is possible that we are already ready for our first rally in a downtrend; especially with AAPL due to make a new product announcement on Monday. This has the attention of traders who appeared to hold back from selling on Friday -- probably expecting this to have a positive effect on the market. Will they "sell on the news"?
There are lower projections, according to the established counts in the P&F charts, which are probably valid since all the past corrections have declined to the (mauve)120 DMA before finding support. One of these days, a correction will go past it and reach all the way down to the bottom channel line, but I don't know if we are quite ready for that at this time. Besides the AAPL announcement, Monday is also the date on which the ECB is supposed to announce its first bond purchase. Perhaps this is a better reason why weakness was not universal on Friday.
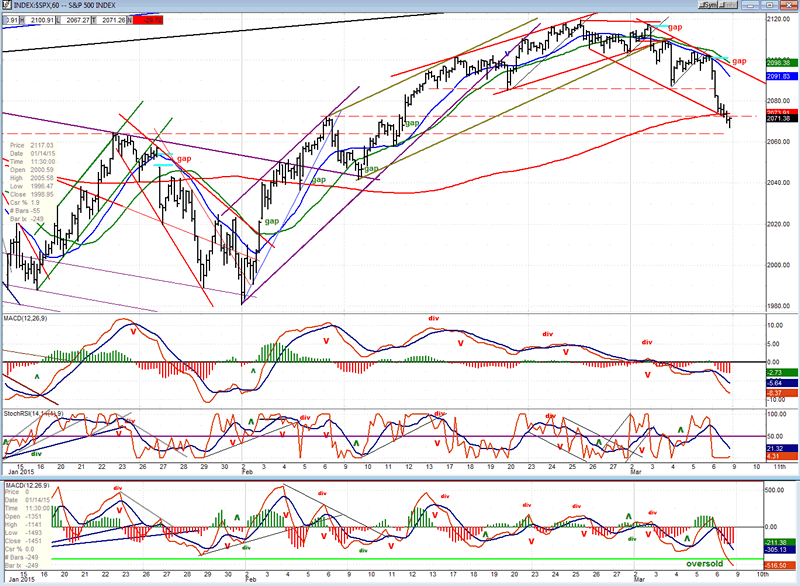
The hourly chart. If you recall in the last letter I mentioned that on the hourly chart we had ended the week at the bottom of two channels and that, if we broke through, it could be the beginning of a correction. In fact, the index bounced off those channel lines; but by Tuesday, they were ready to punch through. There was a little rally to the broken trend lines, and then prices started to fall.
They fell on Tuesday, rallied on Wednesday and Thursday, and then plunged to the initial projection on Friday. This left the oscillators very oversold, especially the A/D which made the lowest low of the year. At the same time, this kind of weakness, especially when it breaks below the outside channel line, is indicative of downside acceleration. So unless there is some very unusual market behavior next week, we are not yet ready to arrest the decline, even if we do find some support on the 200 MA.
Sentiment Indicator
As a matter of course, I do not like sentiment indicators. I prefer to analyze the market primarily by watching the supply and demand forces doing battle with each other. However, I believe that the SentimenTrader was unusually helpful and this is why I used it (as long as it was free!).
Now that I understand the Fear & Greed index better and how it is calculated, I am not sure that I will continue to follow it for very much longer. In any case, this is the reading for this week.

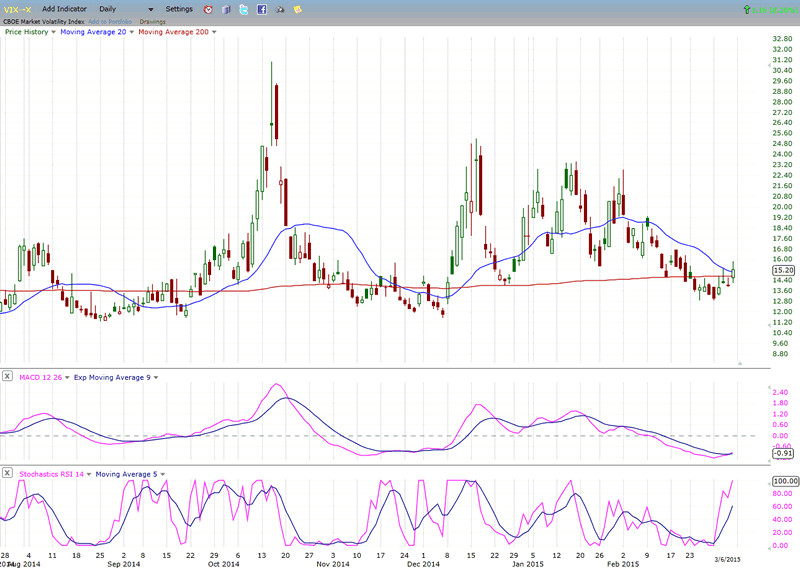
VIX (NYSE Volatility Index) - Leads and confirms market reversals.
One of the oddities in Friday's sharp decline in SPX was the fact that VIX showed relatively little activity. I am not sure if this should be interpreted as bullish or bearish for the market. VIX seemed more attuned to the sectors which showed less weakness.
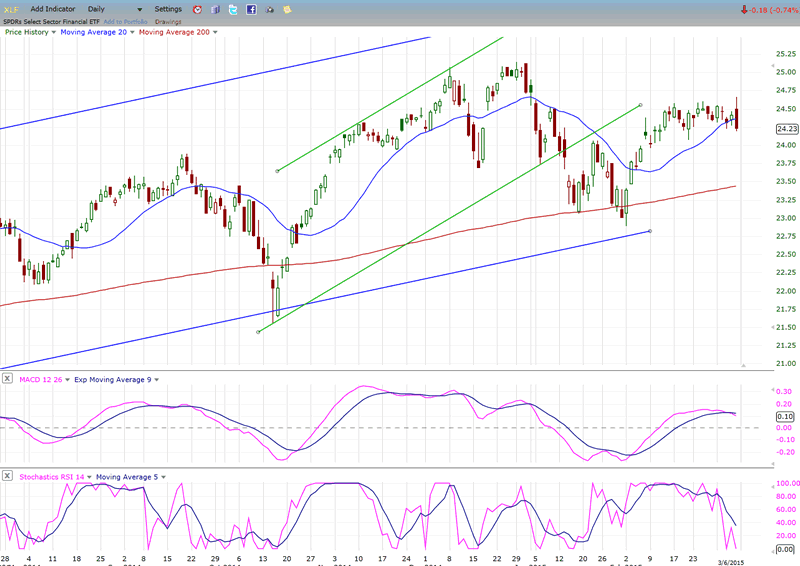
XLF (Financial Sector SPDR) - Historically a market leader.
XLF had a big swing on Friday. It first rose sharply to 24.66 on the strong jobs report, but sold off with the market, closing near the low of the day at 24.24. In spite of its loss, the action was relatively stronger than SPX.
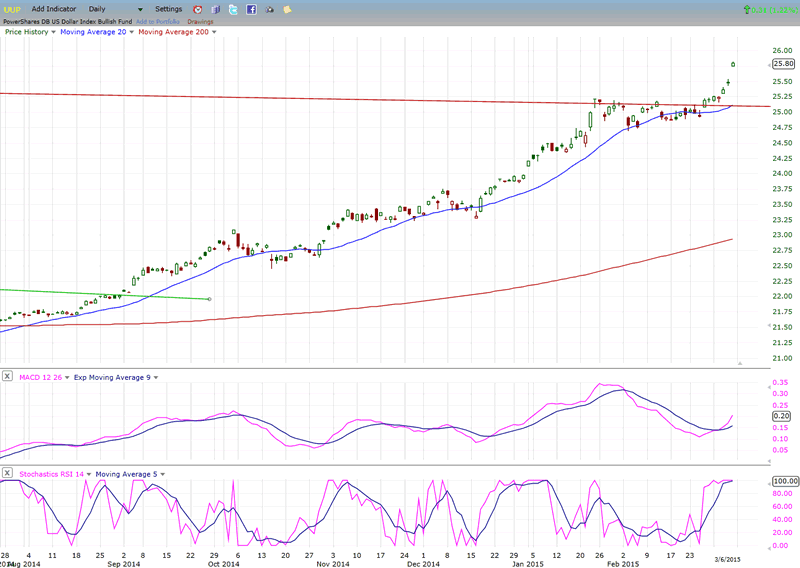
UUP (dollar ETF)
UUP had another strong move, gapping open on the jobs report. It has now cleared the top of its wide correction channel, but looks extended with some divergence beginning to appear in the MACD. Let's make sure that this was not an exhaustion gap foretelling more consolidation ahead.
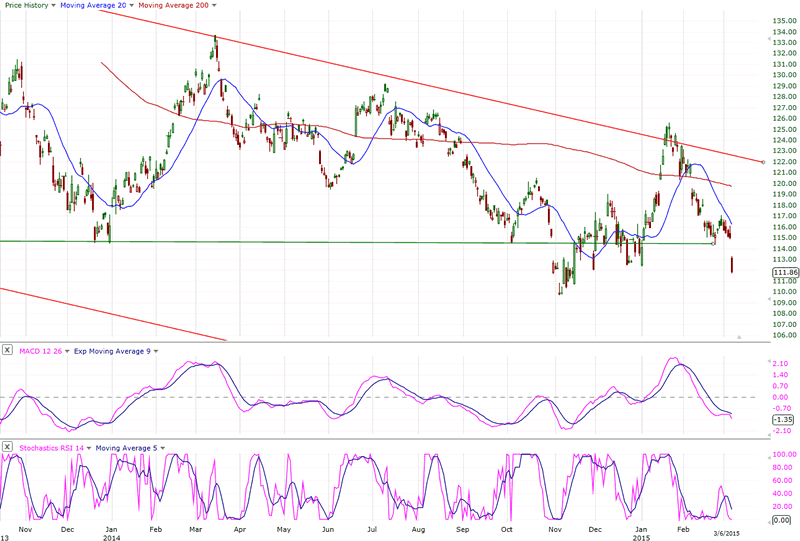
GLD (Gold trust)
GLD responded to UUP's strength with a move in the other direction. It is now past the peak of its 25-wk cycle and will have more and more difficulty resisting its downward pressure for the next 6 or 7 weeks.
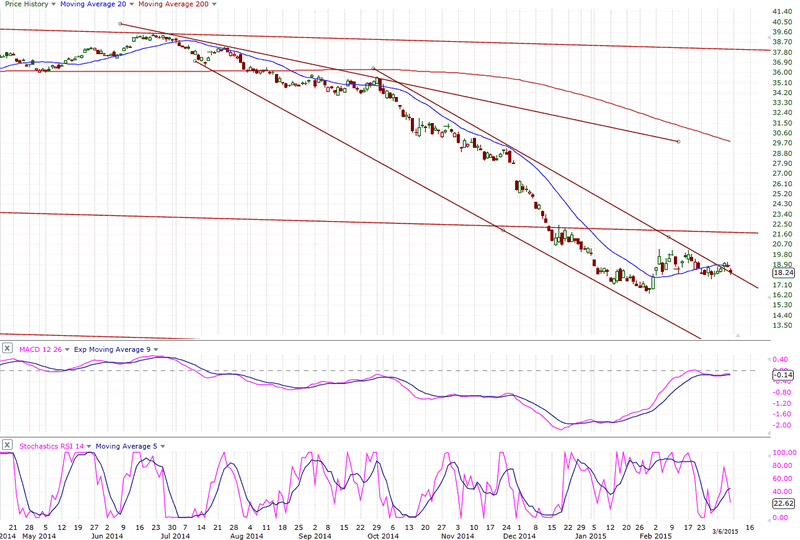
USO (US Oil Fund)
USO has been consolidating and is now trying to move out of its steep down channel. It may succeed in extending its correction outside of it, but will have to prove that it can do something more positive and attempt to start a short-term uptrend. Failure to do so will most likely result in new lows.
Summary
While a correction is well underway in the SPX and NYSE, some indices are not as weak and will need to join them for an important decline to take place.
On Monday the ECB will start its bond buying program. Also on Monday, AAPL will introduce another major product. Both of these events may affect the market, at least temporarily. Let's see how stocks react next week.
FREE TRIAL SUBSCRIPTON
If precision in market timing for all time framesis something that you find important, you should
Consider taking a trial subscription to my service. It is free, and you will have four weeks to evaluate its worth. It embodies many years of research with the eventual goal of understanding as perfectly as possible how the market functions. I believe that I have achieved this goal.
For a FREE 4-week trial, Send an email to: info@marketurningpoints.com
For further subscription options, payment plans, and for important general information, I encourage
you to visit my website at www.marketurningpoints.com. It contains summaries of my background, my
investment and trading strategies, and my unique method of intra-day communication with
subscribers. I have also started an archive of former newsletters so that you can not only evaluate past performance, but also be aware of the increasing accuracy of forecasts.
Disclaimer - The above comments about the financial markets are based purely on what I consider to be sound technical analysis principles uncompromised by fundamental considerations. They represent my own opinion and are not meant to be construed as trading or investment advice, but are offered as an analytical point of view which might be of interest to those who follow stock market cycles and technical analysis.
Andre Gratian Archive |
© 2005-2022 http://www.MarketOracle.co.uk - The Market Oracle is a FREE Daily Financial Markets Analysis & Forecasting online publication.