


Stock Market VIX Indicator Pointing to Final Capitulation Lows
Stock-Markets / Volatility Jul 17, 2008 - 12:26 AM GMTBy: Marty_Chenard

 Staggered capitulation indications are now coming in from market indicators ...
Everyone is looking at the VIX (Volatility Index) and wondering where and when it will show the capitulation that the Pit Traders have been looking for.
Signs of capitulation can be seen on more than one indicator ... not just the VIX. Watching other indicators is especially important now, because the VIX is showing abnormal readings due to extreme and opposite sector volatility coming from energy, and financials. (The extreme rises and swings from the oil and energy groups are offsetting the dropping financials and "dampening the rise on the VIX".)
So, this morning we will look at other market indicators that have correlated levels of capitulation to the market. These will be important to look at since the VIX is showing "out of context" movement due to sector extremes.
___________________________________________
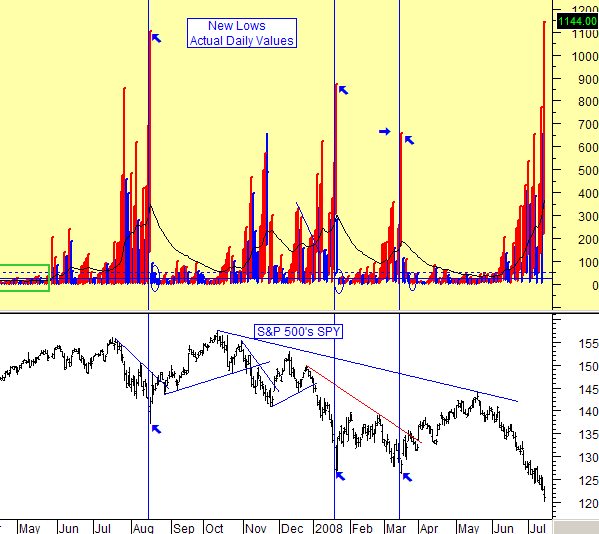
The first indicator/index we will look at is the action on the New York Stock Exchange daily lows. At the bottom of the chart below, I have also plotted the SPY (ETF for the S&P 500), so you can see the correlation.
Note that extreme "up spikes" often signal that a capitulation level is being reached. This is more true when the New Lows are above 800 from an historical basis.
Since 2000, there have been 8 occurrences where the New Lows have gone above a daily close of 700.
- Four of those times signaled the final capitulation.
- There were two other occasions where the New Lows went above 700 and remained below 900, and then they were followed by a New Lows level exceeding 1,000 which were the final capitulation levels . (These resulted in a total of 4 readings.) The previous time this happened was August 16th. of 2007, and the other occurrence was yesterday when the New Lows reached 1144. (The NYSE New Lows are posted every day on our paid subscriber site.)
So, from a New Lows historical basis, yesterday was at a level that correlated with a high capitulation probability. However , this morning, the Labor Department reported that consumer prices jumped 1.1 percent last month. This was the second largest monthly advance in 26 years. With the Fannie Mae/Freddie Mac problems, and this morning's huge inflation jump, there is a possibility that yesterday's New Lows historical reading could have more to go. Past "New Low" spikes did not have the double punch of the aforementioned events, so we do not know the after effect these events will have on historical levels.
(Note that I have placed the blue vertical lines just before each event so that you can see the data without a line going through it.) See the next chart ...
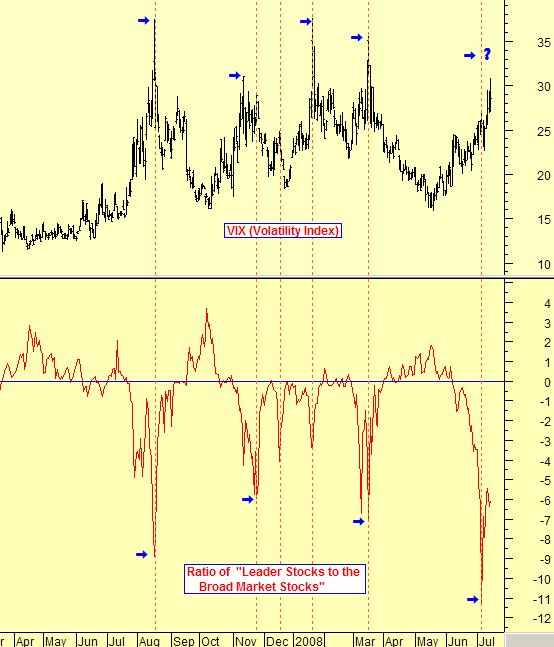
The Second Indicator: The VIX vs. the Leadership to Broad Market Stock Ratio ..
Every night, we do a measurement of the Ratio of Leadership and Broad Market stocks trending up or down. From this, we create a Ratio that shows how the Leadership stocks are trending relative to the broad market. The value of this indicator/index is that Leadership stocks always lead the market up and always lead the market down. Large down spikes on the ratio correlate with the VIX and rightly so.
Since the VIX is moving with abnormal readings due to sector extremes, watching the action of the trending Ratio of Leadership stocks to Broad Stocks is important. (The Ratio of Leadership stocks to Broad Stocks is posted every day on our paid subscriber site.)
The chart below compares the VIX spikes and the spikes on the Ratio of Leadership stocks to Broad Stocks.
During the past year, there were three events where the spikes in both indicators had occurred simultaneously as they should. There was one event last October where the timing was off, but none the less, there was a VIX spike shortly thereafter. What is truly puzzling here, is what is currently happening. We just had the largest , one year spike down on Leadership stocks on July 7th., and the VIX had a meager rise WITH NO spike up. Like November 2007, it is possible that the VIX will show a lagging relationship, and that the New Lows and the Ratio of Leadership stocks to Broad Stocks are showing a satisfactory level of capitulation.
Options expiration occurs this Friday , so by Monday we may indeed know if we have reached satisfactory capitulation levels. And, ... on Monday, a new SEC rule is going into effect regulating shorting activity. That should act as a braking mechanism to market down movements. (The new rule will be in effect through the end of July and may be extended through August.)
Do you have a friend or fellow investor that you think would appreciate receiving a link to this page of Today's Analysis"?
If so, simply click on the link below to quickly and easily forward an email link . It is completely private, so we won't even know if you send one. Send This Page To a Friend
By Marty Chenard
http://www.stocktiming.com/
Please Note: We do not issue Buy or Sell timing recommendations on these Free daily update pages . I hope you understand, that in fairness, our Buy/Sell recommendations and advanced market Models are only available to our paid subscribers on a password required basis. Membership information
Marty Chenard is the Author and Teacher of two Seminar Courses on "Advanced Technical Analysis Investing", Mr. Chenard has been investing for over 30 years. In 2001 when the NASDAQ dropped 24.5%, his personal investment performance for the year was a gain of 57.428%. He is an Advanced Stock Market Technical Analyst that has developed his own proprietary analytical tools. As a result, he was out of the market two weeks before the 1987 Crash in the most recent Bear Market he faxed his Members in March 2000 telling them all to SELL. He is an advanced technical analyst and not an investment advisor, nor a securities broker.
Marty Chenard Archive |
© 2005-2022 http://www.MarketOracle.co.uk - The Market Oracle is a FREE Daily Financial Markets Analysis & Forecasting online publication.