


SPX Stock Market Uptrend Resumes
Stock-Markets / Stock Markets 2016 Jul 30, 2016 - 03:45 PM GMTBy: Tony_Caldaro

 The week started off at SPX 2175, then spent the entire week trading within the two week, 20 point/1% trading range, until it nudged above it by one point on Friday. In the end the SPX made an all time high at 2177. For the week the SPX/DOW lost 0.45%, and the NDX/NAZ gained 1.30%. Economic reports for the week were negatively biased. On the downtick: Case-Shiller, consumer confidence/sentiment, durable goods, the Chicago PMI, plus weekly jobless claims rose. On the uptick: Q2 GDP, new/pending homes sales. Next week will be highlighted by monthly payrolls and ISM.
LONG TERM: uptrend
For the past few months we have been following two specific counts. The NYSE Primary V count, and the SPX Primary B count. For now both counts suggest higher prices ahead, at least in the medium term. A third count, introduced last week and posted on the DOW charts, suggest much higher prices ahead. But we will leave that for another time.
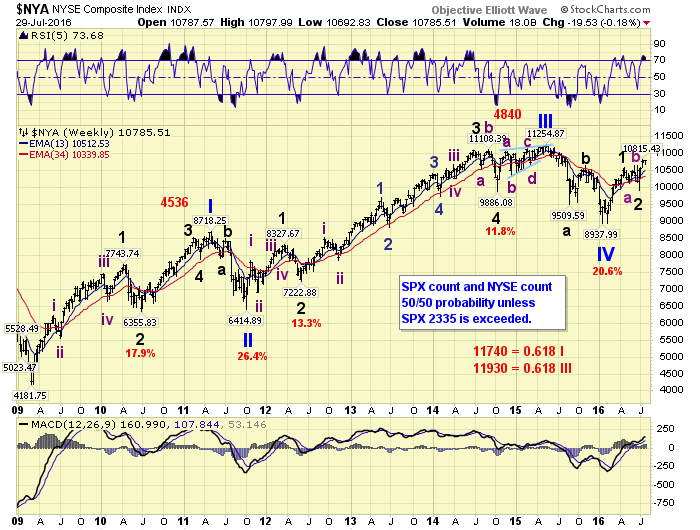
The Primary V count in the NYSE has been underway since the Primary IV February low. Thus far we have observed a Major wave 1 uptrend, then an irregular Major wave 2, and currently a Major wave 3 uptrend underway since the June low at 9919. Primary V should consist of five Major waves, plus the NYSE should at least make a new all time high. Currently it is still about 4% below the 11,285 all time high made in 2015.
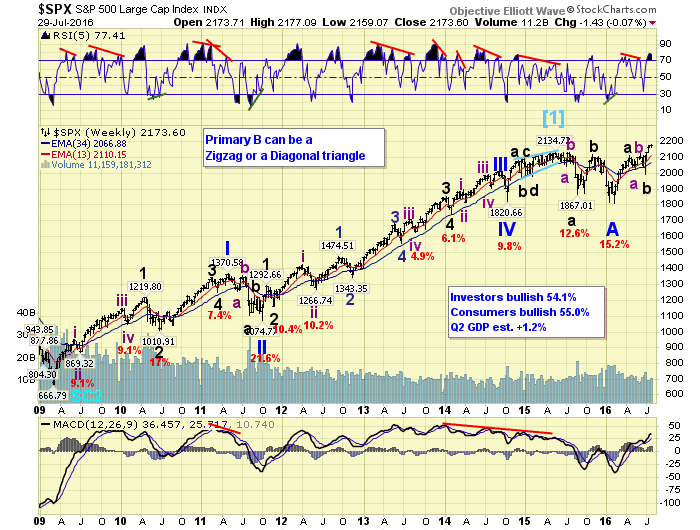
The Primary B count in the SPX has been underway since the Primary wave A February low. Thus far we have observed a Major wave A uptrend, then an irregular Major wave B decline, and currently Major wave C underway from the June SPX 1992 low. Primary B should consist of three Major waves, and oddly enough the SPX has already made all time new highs.
There is also the possibility of counting the three wave advance to SPX 2121 as Major A, the decline to SPX 1992 as Major B, and now another three wave advance for Major C. These last three waves could coincide with Majors 3, 4 and 5 in the NYSE. Should this occur these two indices would be back in sync, and the bifurcation will have ended as both decline in bear markets. However, should SPX 2335 be exceeded before all of this unfolds, then the Primary B count will be abandoned in favor of the alternate DOW count. Lots of possibilities in the months to come, while the indices work their way higher.
MEDIUM TERM: uptrend
After the February SPX 1810 low the SPX had a 301 point uptrend (1810-2111), an 85 point downtrend (2111-2026), a 95 point uptrend (2026-2121), then a 129 point downtrend (2121-1992). During this uptrend we have been focusing on the first uptrend (1810-2111) for comparative purposes.
That first uptrend advanced in five waves [1810]: 1947-1891-2075-2034-2111. The first wave was 130+ points, the third wave 180+ points, the fifth wave was 70+ points, and the two declines, waves two and four, were between 40+ and 50+ points.
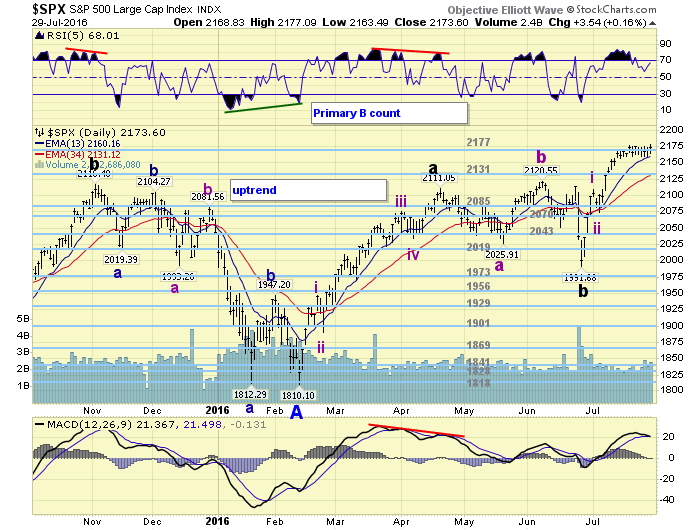
The current uptrend started off strongly enough but has been weakening as of late [1992]: 2109-2074-2177 so far. The first wave was 110+ points, the second wave 30+ points, and the third wave 100+ points so far. This uptrend has been less volatile than the first, smaller pullbacks, and the third wave has yet to exceed the first. Thus far clearly a bit weaker. Nevertheless, we are maintaining our upside target for this uptrend between SPX 2250 and 2280. Medium term support is at the 2131 and 2085 pivots, with resistance at the 2177 and 2212 pivots.
SHORT TERM
This uptrend, as noted above, has thus far advance in three waves. The first two waves were quite swift with few subdivisions. This third wave has been subdividing into five clear Minor waves: 2109-2089-2176-2159-2177 so far. Minor wave 4 was quite a trading range ordeal, as it remained in a 1% range for about two weeks. With Friday’s tick up to SPX 2177, we were able to accept the Minor 4 low at SPX 2159 this week.
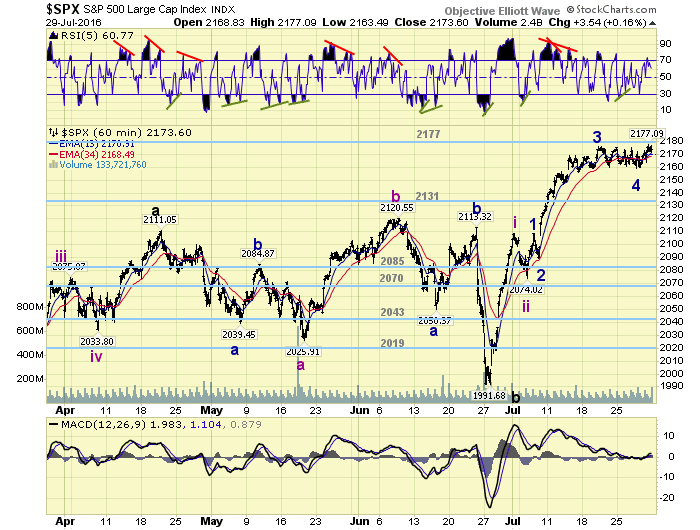
With the fifth wave underway for Intermediate wave three we can make some Fibonacci projections. These projections at 2 points: 2180, 2193, 2214 and 2248. Since our target all along has been the OEW 2212 pivot, that appears to be the most probable area. When Int. three does conclude the market should have its biggest pullback since Int. wave two (35 points) for Int. four. Then higher highs should follow for Int. five. Short term support is at the 2131 and 2085 pivots, with resistance at the 2177 and 2212 pivots. Short term momentum ended the week slightly below overbought. Best to your trading!
FOREIGN MARKETS
Asian markets were mixed on the week for a net gain of 0.1%.
European markets were also mixed but gained 0.4%.
The Commodity equity group was also mixed and lost 0.7%.
The DJ World index gained 0.9%.
COMMODITIES
Bonds appear to be in a downtrend but gained 0.5%.
Crude is in a downtrend and lost 5.9%.
Gold is still in an uptrend and gained 2.6%.
The USD appears to be in a downtrend and lost 2.1%.
NEXT WEEK
Monday: ISM and construction spending at 10am. Tuesday: personal income/spending, the PCE, and auto sales. Wednesday: the ADP and ISM services. Thursday: weekly jobless claims and factory orders. Friday: monthly Payrolls (est. 180K), trade deficit and consumer spending. Best to your weekend and week!
CHARTS: http://stockcharts.com/public/1269446/tenpp
After about 40 years of investing in the markets one learns that the markets are constantly changing, not only in price, but in what drives the markets. In the 1960s, the Nifty Fifty were the leaders of the stock market. In the 1970s, stock selection using Technical Analysis was important, as the market stayed with a trading range for the entire decade. In the 1980s, the market finally broke out of it doldrums, as the DOW broke through 1100 in 1982, and launched the greatest bull market on record.
Sharing is an important aspect of a life. Over 100 people have joined our group, from all walks of life, covering twenty three countries across the globe. It's been the most fun I have ever had in the market. Sharing uncommon knowledge, with investors. In hope of aiding them in finding their financial independence.
Copyright © 2016 Tony Caldaro - All Rights Reserved Disclaimer: The above is a matter of opinion provided for general information purposes only and is not intended as investment advice. Information and analysis above are derived from sources and utilising methods believed to be reliable, but we cannot accept responsibility for any losses you may incur as a result of this analysis. Individuals should consult with their personal financial advisors.
Tony Caldaro Archive |
© 2005-2022 http://www.MarketOracle.co.uk - The Market Oracle is a FREE Daily Financial Markets Analysis & Forecasting online publication.