


How to Spot an Oversold Stock Market
Stock-Markets / Stock Markets 2016 Aug 23, 2016 - 02:23 PM GMTBy: Chris_Vermeulen

 All traders have found their own mix of technical analysis indicators and price action which they feel provides them with a good feel for when the stock market is oversold and overbought. Let’s face it, as traders, we see the market is a different way and its limitless as to how we can trade each and every situation.
Here I would like to share with you a couple of my tools and tricks for timing short term stock market bottoms. Over the years I have refined my analysis to just a handful of tools and analysis that work consistently for me. I have also learned that I trade and analyze the markets best if I don’t read other people’s opinions and analysis as it has a way of altering my thinking and thus I start to second guess where the market is headed.
The indicators/tools I prefer are the 20-day simple moving average for trend direction, support and resistance levels. I watch the Bollinger bands during times when they pinch/narrow as that is when the price is likely to explode in either direction. Also, I watch two volume ratios of the NYSE which you will see on two of the charts below. This indicator tells me when the majority of market participants are running to buy more shares or panicking and hitting the sell button. The 30 minute and 3-minute charts are my favorite for trading and identifying chart patterns.
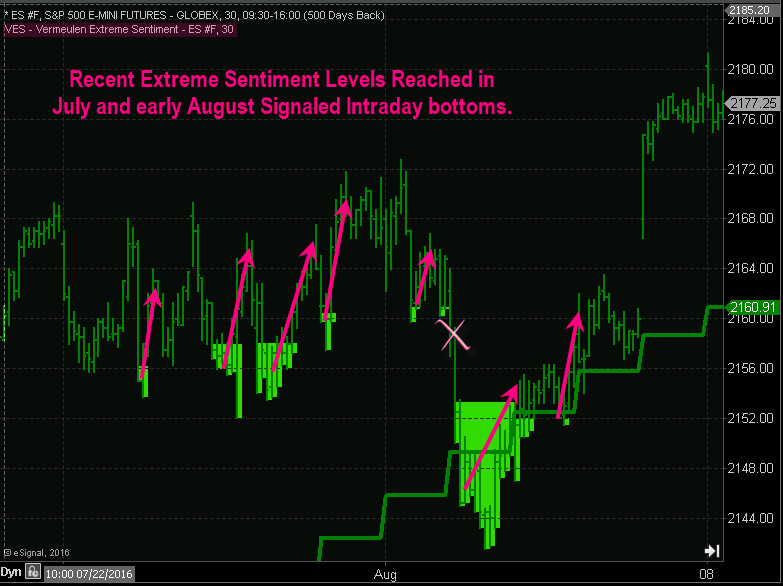
Last week of July – first week of Aug VES Signals
VES is a special indicator I have been developing to help identify intraday oversold levels and overbought levels. The level which big money steps back into, or out of the market when these extreme levels are reached.
Notice in the chart below the lime green areas which price reversed from for quick and steady returns.
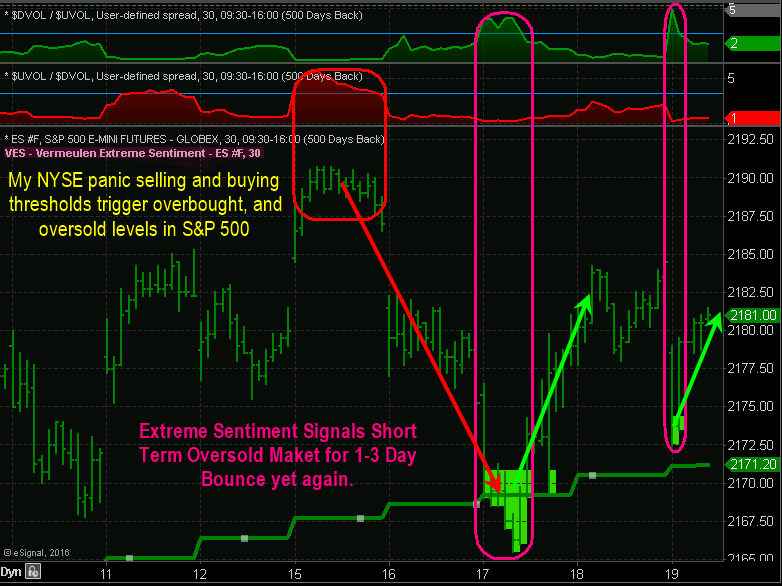
Last Week’s VES Extreme Levels Signaled Including Overbought
Here you will see the both extreme overbought and oversold levels on the chart. I didn’t highlight it on the chart but take a look at Aug 11th. You will notice the red NYSE indicator at the top moved above the blue threshold line indicating everyone was buying. This happened again on the 15th. The general rule is, when everyone is doing the same thing, you best take the other side of the trade.
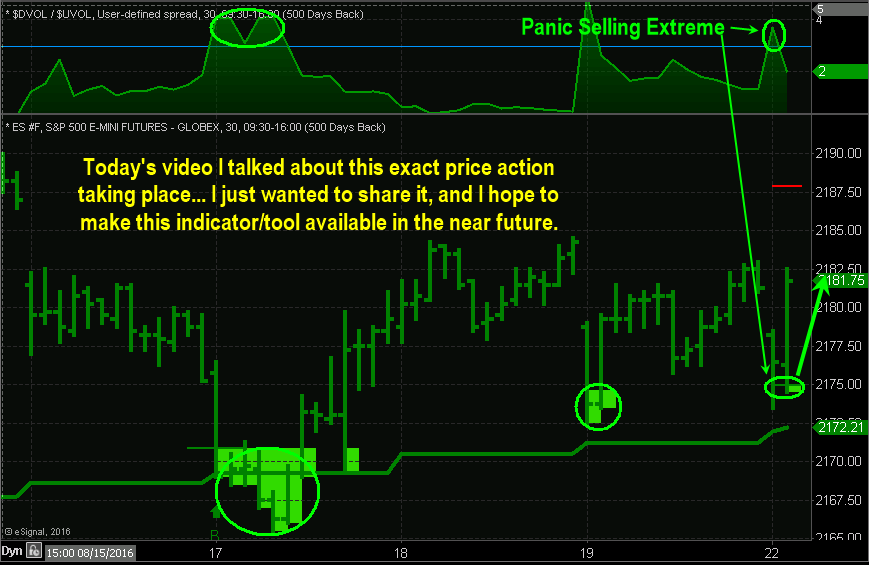
Monday, Aug 22nd – This Weeks VES Signal
What you want to look at on this chart is Monday, Aug 22nd. This is something I can see unfolding before it happens based on other market characteristics and I notified subscribers of my ETF trading newsletter about this during pre-market trading and for them to expect an extreme pivot low today in the morning.
Concluding Thoughts:
In short, these trade may look little at first glance only being a fraction of a percent move each signal. But keep in mind, the shorter the time frame you trade, and the more accurate a trade setup is, the more capital you can put at risk.
My focus on these trade setups are 3x ETFs or better yet ES mini futures contracts. With one futures contract these 5 – 20 point moves allow you to pocket $250 – $1000 within a few hours in most cases.
Trade with me at: www.TheGoldAndOilGuy.com
Chris Vermeulen
Chris Vermeulen is Founder of the popular trading site TheGoldAndOilGuy.com. There he shares his highly successful, low-risk trading method. For 7 years Chris has been a leader in teaching others to skillfully trade in gold, oil, and silver in both bull and bear markets. Subscribers to his service depend on Chris' uniquely consistent investment opportunities that carry exceptionally low risk and high return.
Disclaimer: Nothing in this report should be construed as a solicitation to buy or sell any securities mentioned. Technical Traders Ltd., its owners and the author of this report are not registered broker-dealers or financial advisors. Before investing in any securities, you should consult with your financial advisor and a registered broker-dealer. Never make an investment based solely on what you read in an online or printed report, including this report, especially if the investment involves a small, thinly-traded company that isn’t well known. Technical Traders Ltd. and the author of this report has been paid by Cardiff Energy Corp. In addition, the author owns shares of Cardiff Energy Corp. and would also benefit from volume and price appreciation of its stock. The information provided here within should not be construed as a financial analysis but rather as an advertisement. The author’s views and opinions regarding the companies featured in reports are his own views and are based on information that he has researched independently and has received, which the author assumes to be reliable. Technical Traders Ltd. and the author of this report do not guarantee the accuracy, completeness, or usefulness of any content of this report, nor its fitness for any particular purpose. Lastly, the author does not guarantee that any of the companies mentioned in the reports will perform as expected, and any comparisons made to other companies may not be valid or come into effect.
Chris Vermeulen Archive |
© 2005-2022 http://www.MarketOracle.co.uk - The Market Oracle is a FREE Daily Financial Markets Analysis & Forecasting online publication.