


Gold And Silver 2017 – The Golden Lye
Commodities / Gold and Silver 2017 Jan 01, 2017 - 03:08 PM GMTBy: Michael_Noonan

 Lye – [noun] a strongly alkaline solution, esp. of potassium hydroxide, used for washing or cleansing.
There has indeed been an ongoing cleansing in the precious metals market since the spike highs five years ago. Remember, there have been calls for a massive turnaround in prices for both gold and silver since 2013…2014…again, even more so in 2015. 2016 has just freshly passed, and both metals continue to flirt with their lows from a year ago. A few years ago, all the rage was for the man and woman on the street to be buying gold and silver coins, long lines, especially in China, forming for blocks to make purchases for the inevitable rally “sure” to soon follow.
During that time, we mentioned that individuals, small traders, et al, rarely, if ever, get in at the bottom or get out at the top of market turns. Both gold and silver were much higher, a few years ago, but the moneychangers continue to prevail as the “cleansing process” is still ongoing, tiring out the masses who had been certain that gold and silver would soar to $5,000+ in gold, $200-$300 in silver.
Gold closed the year at 1158; silver at 15.98. The lies by the elites’ central banks continue: gold is useless. The favorite add-on line was that gold did not yield any interest. Having stripped their phony fiat paper money of all interest, in fact now charging negative rates, now paper fiat no longer yields any returns. Now, the drive is to eliminate, first, higher denominated fiat currencies, [it will happen in the US, count on it], and then followed by a total removal of all cash. The globalists are corralling everyone into their digitalized banking system where no one will have any financial freedom, none!
The Golden Lye is the result of the globalists’ Big Lie. While they are in the process of destroying all physical “currencies,” [debt, disguised as money], the globalists have also been accumulating as much physical gold as they can. “Do as we say, not as we do.” Sadly, people follow their dictates.
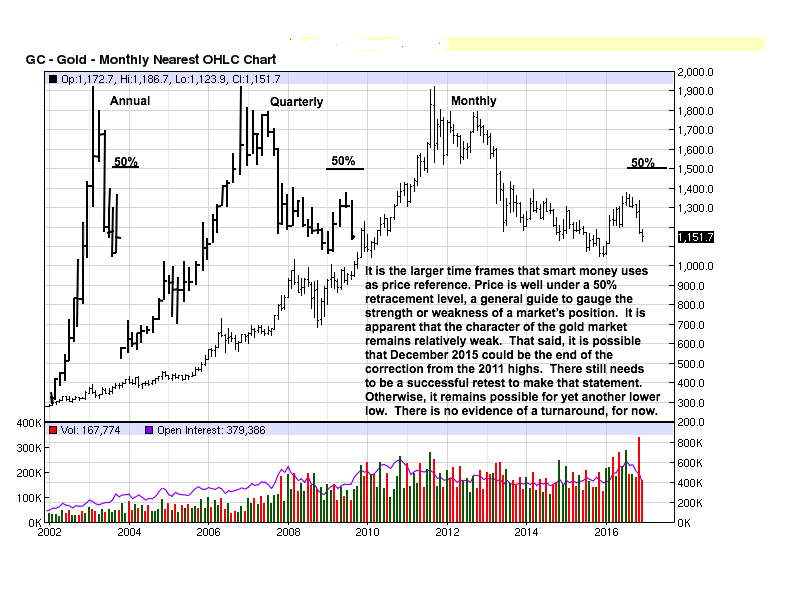
Charts can be confusing, at times, but they never lie. It is for that reason why we reference them to the exclusion of what people say. The charts show what people actually do. At the close of the year, we are including abbreviated Annual and Quarterly charts drawn onto the monthly chart for gold and silver.
Most people concentrate on the daily and even intra day charts, getting caught up in the “noise.” Smart money follows the longer term charts, starting with the monthly. They are not concerned with the day-to-day price fluctuations like most traders are. Even holders of physical gold and silver grow impatient with each passing week, month, year, disappointed with current price levels. This is not true of the central bankers, and it is certainly not true of the largest gold accumulators, China, Russia, even India.
Charts are most reliable when there is synchrony with the various time frames, and we see this in the three time frames: Annual, Quarterly, and Monthly. The position of the price of gold remains near recent lows and well under the 50% retracement level. The half-way mark is a general guide to measure the “health” of a market. For Bears, price being well under the 50% level means Bears are comfortable with their positions. For Bulls, being so far under that level indicates weakness with no signs of a turnaround.
That last statement can be qualified by saying the 2015 lows could be the end of the decline from the 2011 highs, but there needs to be a confirming retest that those lows will hold. We mention that potential because price closed at the lows on the Annual chart in 2015 and rallied sharply during 2016, leaving this who sold lower in trouble, and those who liquidated their positions are now out of the market and will pay higher to get back in, if they can still afford it.
The Quarterly chart shows small ranges going into the low, a sign that sellers could not extend the range lower, implying buyers were supporting the market. The 1st Qtr of 2016 was a strong rally and close to mark a change of behavior from all of 2015. The 4th Qtr ending in 2016 was a large range down, closing at the low [which can sometimes be exhaustion selling and a trap, yet to be determined], but the wide range with a close in the lower half was still above above the 1st Qtr lows, even almost at the 50% range of that bar.
The same assessment can be made on the monthly chart. Note how wide the range was to the downside for November, on record volume, followed by a very small range for December. Any time you see exceptional volume levels, it almost always marks a change from weak hands into strong. While it appears to be negative, the volume more than likely means strong hands were buying everything weak hands were selling.
The small December range indicates sellers were held in check by buyers who prevented the range from extending lower. This also implies support, even though the apparent price structure “appears” to still be weak, and it supports the November volume assessment that smart money is buying and positioning themselves for an eventual higher price level. The operative word is “eventual.” Globalists/central bankers are never in a hurry.
The takeaway message from the longer term timeframes is that gold remains weak; whether it is bottomed or not lacks confirmation, so one should not expect an immediate rally to the upside. An economic shock of some kind could cause price to rally sharply, but that would be an anomaly, at least as to timing. Under so-called normal market conditions, it appears that the bottoming process for a turnaround could last a few more years and the same commensurate time frames for Quarterly and monthly activity.
The globalist’s lies continue as does the central banker cleansing of longs and some holders of physical gold and silver. Smart people are willing to hold whatever physical metals they have already purchased, and they are also willing to add at these bargain price levels. The globalists may be able to make fiat “cash” disappear, replaced by imaginary digital blips in one’s bank account, but they cannot make gold disappear [except by buying it, which is what they are doing].
Gold has no third-party counter risk, and it has history on its side as the ultimate wealth preserver. The globalists are doing everything they can to divest gold from people. Do not fall for their lies.
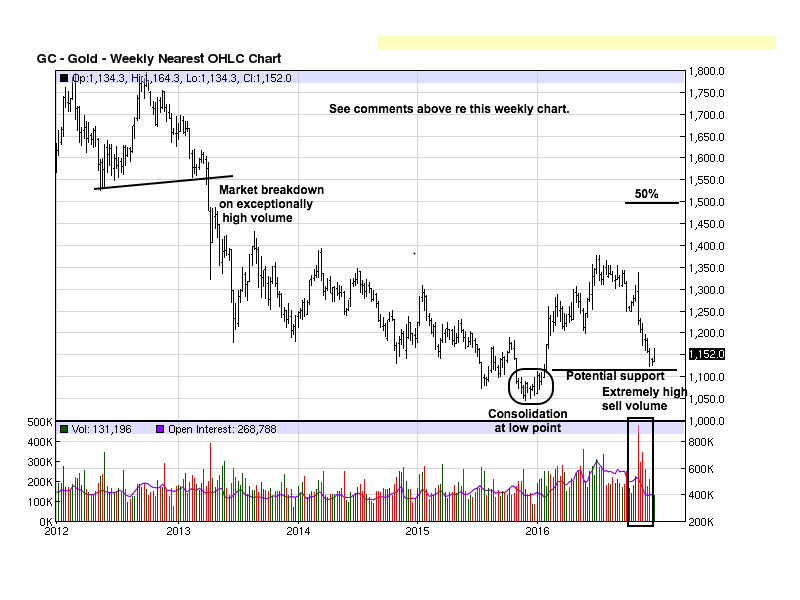
The argument for a weak gold market is a given. The weekly chart is just as weak as the higher time frames. What becomes more interesting for the weekly, and it is even truer for the daily charts, is this is where one will begin to see the first signs of a change in trend.
The 2013 break of support occurred on sharply higher volume, and there was further continuation, not quite the way the daily silver chart has developed, as will be seen in the last of these charts. Shown is the consolidation at the December 2015 lows. Compare that development with previous lows on the chart. Once price rallied away from the lows, that level is now being retested from mid-December. When we say something needs to be confirmed by a successful retest, this is a perfect example.
Should the retest hold, we will be seeing the first potential signs of a change in market behavior that can lead to a change in trend. Keep in mind, market bottoms can be very protracted, and the higher time frames are not indicating a change any time soon.
The extreme volume in November is occurring near recent market lows, as opposed to much higher levels. Because the high volume is near lows, it gives credence to assessing the high volume as a change from weak-handed sellers into stronger-handed buyers. It takes time for strong hands to accumulate positions, and it is near impossible to buy all they want at the lows, so they buy fairly close to where they believe, if not know, where price will hold.
This fits with the assessment that there could be some bottoming in the longer term charts that are still way too soon to consider, at least for timing. It is the smaller time frames that are used for timing.
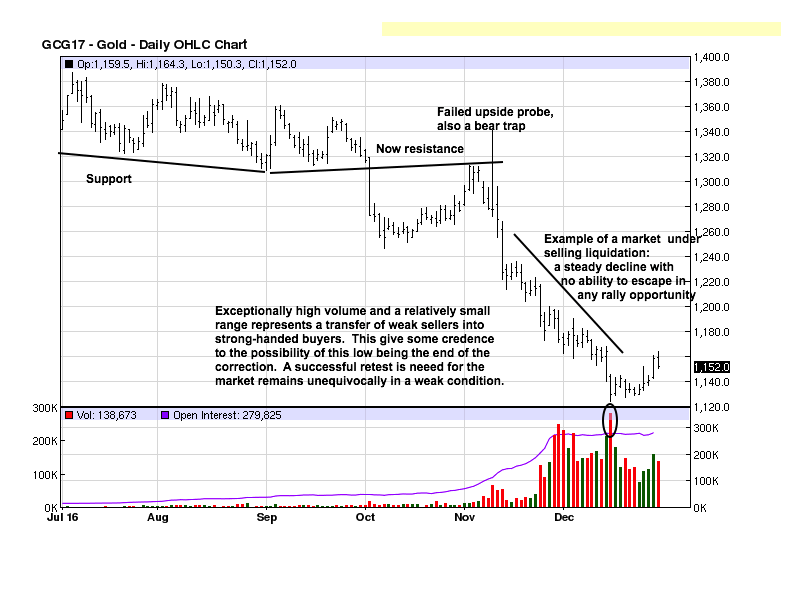
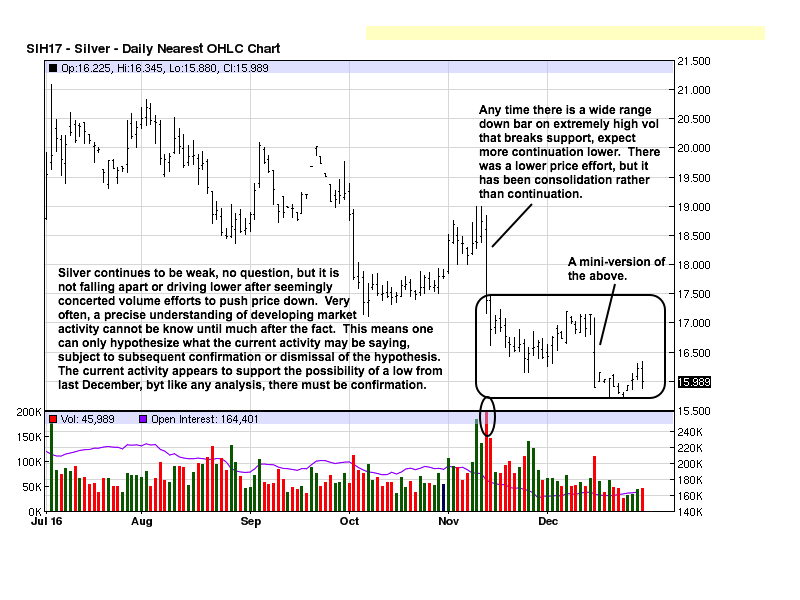
This is a daily contract for the Feb futures contract. The daily silver is a continuation contract. In November, the Dec contract was lead month, so most of the daily volume was greater, at the time. The silver continuation chart shows the activity from the Dec contract which is why the volume shows substantially greater throughout that chart, and there was very little volume in early November on the gold chart because it was not the lead month.
A point to be made is that support/resistance areas are not straight lines drawn in charts [for convenience], as seen in the chart below. Once broken, support becomes resistance. When price rallied in early November, the former supply line acted as resistance. The price spike was a news reaction that failed to hold. Those who bought into the rally were quickly trapped when price finished the day on the lows.
The three days of heavy volume kept buyers trapped as price fell with impunity. The small range bars during the subsequent decline without any kind of rally is an example of a liquidating market where buyers are selling to meet margin calls or simply run out of money and are forced to sell. The tenor of the selling reached a volume climax at the very low.
Note how small the daily range was and how the close was off the lows. Weak hands were selling, and smart money, or strong hands, were buying everything offered. This is why the apparent “sell” volume was unable to extend the range any lower. Note how price then moved sideways in narrow range bars without making a lower low. Buyers were stronger than sellers, and a small rally resulted, last week.
It is much too soon to say the mid-December lows may hold, but they may, in fact, hold. If there is to be a change in trend, this is where it will show up on the daily, long before any change shows on the monthly and higher time frames. Still, even on this lower time frame, [actually any time frame], one move needs to be confirmed to be proven reliable.
Gold prices may hold in around current levels. It would seem price rallies may become more prevalent than declines, and if this is a bottoming area, declines should be narrower ranges and shorter lived, but that is merely an opinion, and opinions do not matter. The market is always the final arbiter.
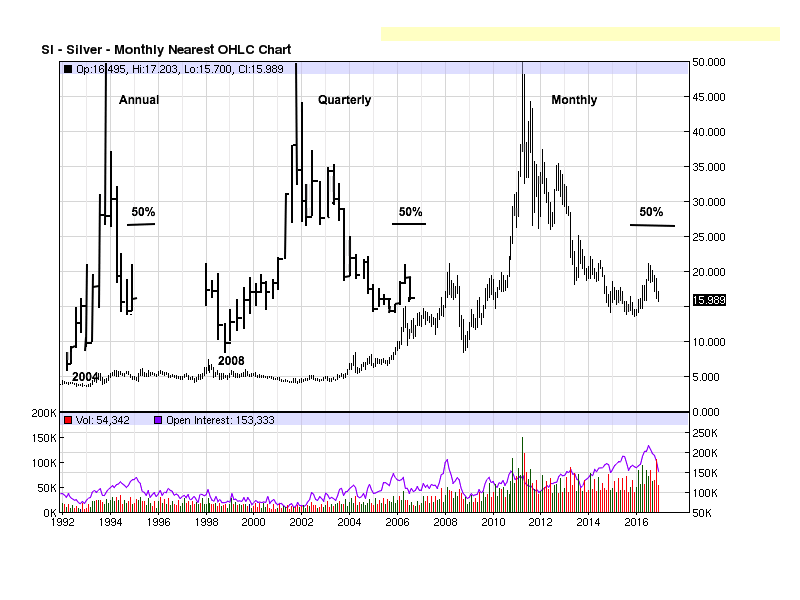
There is a similar pattern in silver as there was for gold. Price hovers near the lows and well under the 50% retracement measure. The close for 2016 on the Annual bar is near the low, but it is also above the closes of the prior two years. Plus, the close for 2015 was on the low which can be exhaustive selling and trapping sellers in that area.
The 3rd Qtr bar, second to last, was a small range that stopped the rally, and the close was nearer the low of the range. This tells us sellers were stronger than buyers. We see evidence of that by the ease of selling for the 4th Qtr of 2016. Yet, the low for the 4th Qtr remained above the low of the 2nd Qtr rally. It is worth being aware of these distinctions in case the character of the market changes in order to be better prepared.
The monthly chart is currently retesting the December 2015 lows. The activity from the 2015 lows are legitimate supports, even going back to early 2010, the last low before the huge rally to the $50 high. This makes the current lows key as potential support.
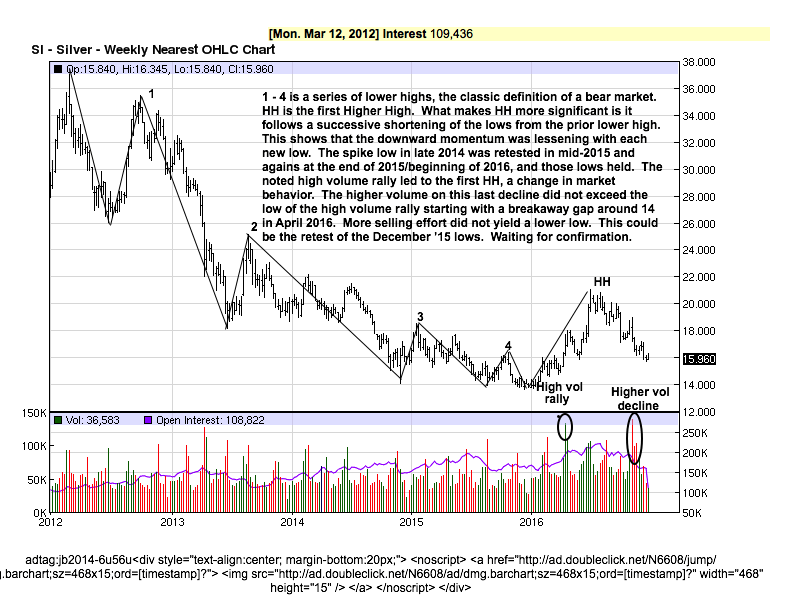
The weekly developing market activity is sufficiently explained on the chart. It helps to draw in the thin lines marking swing highs and lows to cut out the “noise” in between. It is easier to see how each successive low after the swing highs, beginning at 1, became shallower and shallower. Each drive lower made relatively less headway. Even the rallies to the swing highs were shorter, both in distance and duration. You get to see the nature of the market change in real-time.
The final low, after the swing high at 4, was a sideways consolidation, a message that sellers had expended their effort. That was confirmed by the rally to HH, a Higher High that exceeded 3 and 4. This marks a change in the character of the market and becomes an alert for a potential trend change. It needs to be confirmed by a higher low, which is now in progress as you read current price activity.
We alluded to potential signs of change on the higher time frames, and now we see more evidence on this lower time frame. Yet, if there is to be a change in the weekly chart, it will show up on the daily chart, first.
Looking back at the daily gold chart, the high volume sell-off led to further downside continuation. In silver, the high volume sell-off resulted in a sideways move which did lead to another low in December, but the downward movement was more controlled.
None of the charts are calling for a change in trend. There is no reason to be long in the manipulated paper futures market. There is every reason to be buying both physical gold and silver. All Western banks are bankrupt, totally underwater, being propped up by the IMF and a few bail-ins. There is more debt than ever in the world, levels of debt that cannot be sustained for forever. Circumstances, greatly manipulated by the globalists, ensure a change in trend will come.
We are near the end game where reality will make its presence known and the fragile world of Western governments, fiat currencies, stock markets, anything paper, will be destroyed. The globalists are preparing for it, in fact, ensuing that it happens. Nothing can or will stop the global moneychangers from their economic stranglehold on people everywhere.
Cash will disappear, as bankers continue to wage war on it. Can a war on owning gold and silver be far behind? Probably not. If you do not own, and hold, physical gold and silver, the opportunity to protect your economic viability may disappear for generations to come.
Do not listen to the lies of the bankers and the governments they control [all]. Trust in the proven history of the only true money, gold and silver. The charts say there is still time to buy, but any event can trigger a panic and the physical metals will not be had at prices people can now afford.
By Michael Noonan
Michael Noonan, mn@edgetraderplus.com, is a Chicago-based trader with over 30 years in the business. His sole approach to analysis is derived from developing market pattern behavior, found in the form of Price, Volume, and Time, and it is generated from the best source possible, the market itself.
© 2016 Copyright Michael Noonan - All Rights Reserved Disclaimer: The above is a matter of opinion provided for general information purposes only and is not intended as investment advice. Information and analysis above are derived from sources and utilising methods believed to be reliable, but we cannot accept responsibility for any losses you may incur as a result of this analysis. Individuals should consult with their personal financial advisors.
Michael Noonan Archive |
© 2005-2022 http://www.MarketOracle.co.uk - The Market Oracle is a FREE Daily Financial Markets Analysis & Forecasting online publication.