


Key Labor-Day Analogies in Gold
Commodities / Gold and Silver 2017 Sep 07, 2017 - 08:45 PM GMTBy: P_Radomski_CFA

 It was not so long ago, when we wrote about the record-breaking volume in gold. We described the implications of the extreme monthly volume and we discussed the very high readings in case of the individual sessions. We even described these sessions as the most important sessions of the year – at that time. Well, “at that time” those volume readings were indeed extreme, but what we saw yesterday made the previous sessions seem regular. The Tuesday’s volume in gold was the highest that we’ve seen ever (in case of daily upswings). The volume was even higher than the one that accompanied the results of the Brexit voting. With extreme volume, likely come extreme implications.
Let’s take a look at gold’s chart for details (charts courtesy of http://stockcharts.com).
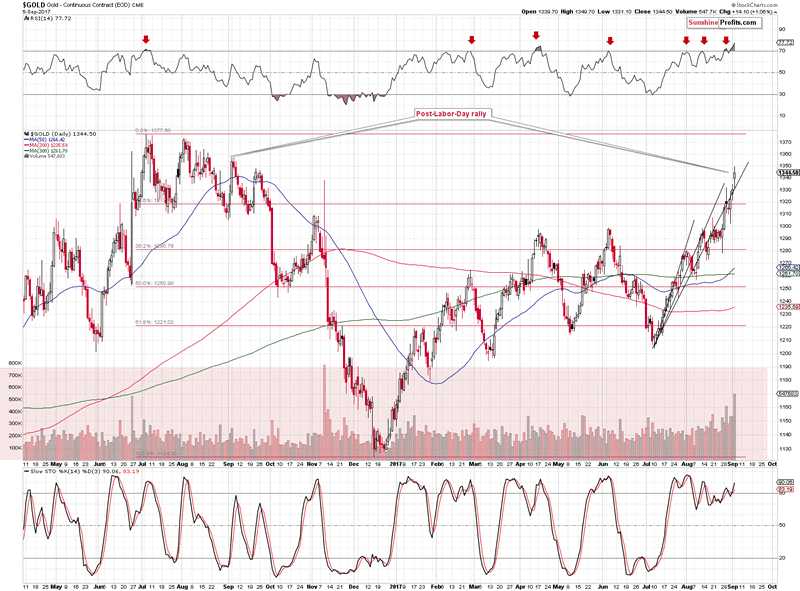
Gold is after a sizable rally, so at this point it would be natural to expect the huge volume to indicate a reversal. This, by itself, does not make it strong bearish factor, but taking into account the current time, does. Yesterday’s session was the first one after the Labor Day. In yesterday’s alert, we discussed the implications thereof in the following way:
- 2011: gold plunged about $300
- 2012: gold moved higher at the beginning of September and shortly thereafter formed the key top – the one that started the biggest decline of the past decades
- 2013: gold declined about $200
- 2014: gold’s decline was underway, but still declined over $100 after the Labor Day
- 2015: rather sideways trading followed by a sharp decline in the final part of the year
- 2016: daily rally right after the Labor Day that started a $200+ decline.
The implications here are clearly bearish – almost always huge declines started either immediately or shortly after the Labor Day. This kind of efficiency alone is something that should make one considering opening the short positions in the precious metals market even without taking into account the situation in the USD Index.
Today, we would like to add more details to the above. Namely, last year, the session that marked the final top before the plunge was not approximately after the Labor Day – it was exactly the first session thereafter. Higher gold prices were not seen since that time. Of course, one might say that one swallow doesn’t make a summer and that could have been just a coincidence. However, there is something that most analysts currently seem to forget…
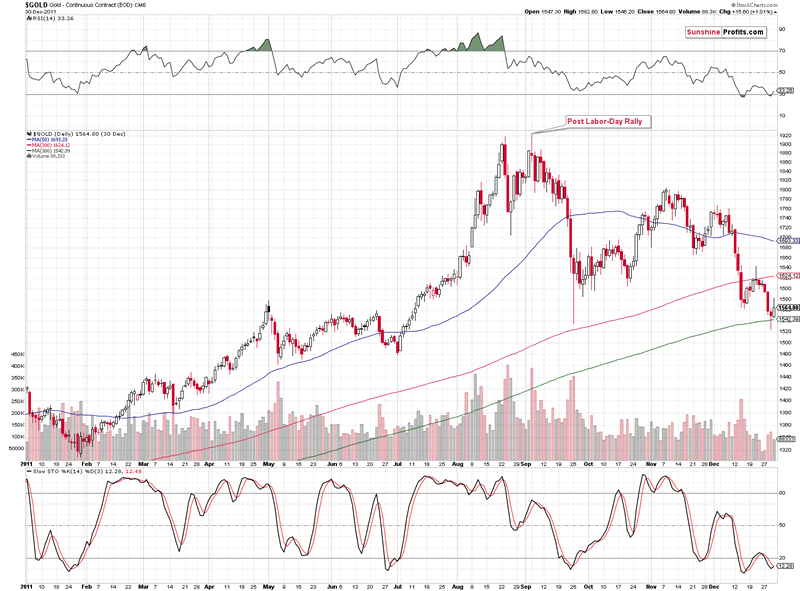
It was the single session after the Labor Day in 2011 that marked THE top after a decade-long rally in gold. Does it still look like a coincidence? The volume that accompanied the 2011 post-Labor-Day top was extreme, which is yet another similarity to the current situation. Gold also moved a bit above the previous intraday high, but not significantly so – just like gold performed relative to the post-Trump-election high.
The current situation is very similar to the previous post-Labor-Day tops. Consequently, gold rallying on record-breaking volume after a sizable rally right after the Labor Day is something that is very likely to be followed by declines – not significant rallies.
Also, based on the size of the previous rally, the time for the current one is up – the 3 rising, black lines on the previous chart apply the sizes of the initial 2016-2017 rallies (ending in January and February) to the rally that started in July. Based on the Tuesday’s upswing, it seems that even if (which is not likely) gold was to rally further, it should take a bigger breather before it does. Based on the long-term factors, it doesn’t seem that it would not be just a breather, but a major downswing, but still – regardless of the above, a short-term decline appears likely either way.
The significantly increased interest in gold confirms it. In yesterday’s alert, we wrote the following:
In today’s analysis, we would like to add a chart that illustrates the above.
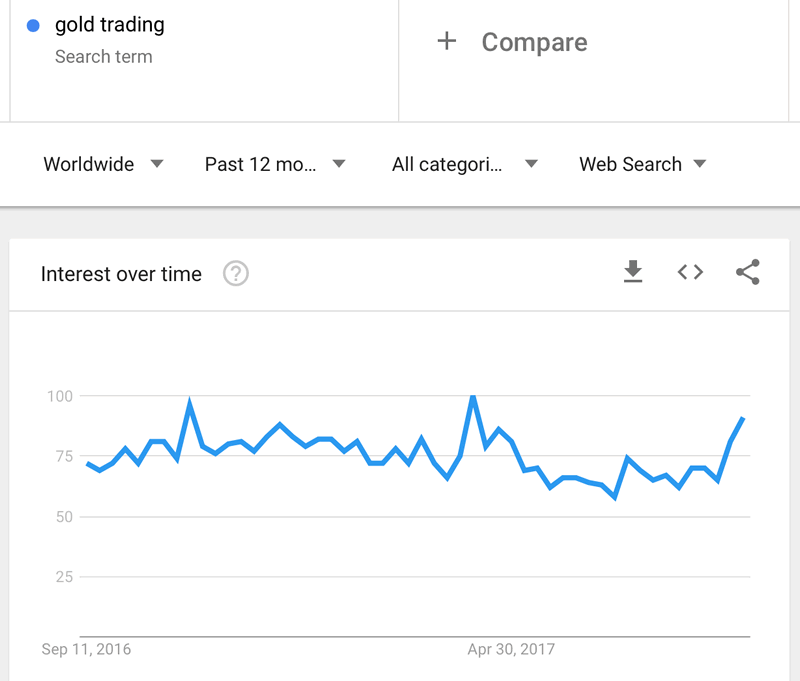
The above chart features data from Google Trends – it shows how often people were searching for the phrase gold trading in the past 12 months. There are 3 cases when the interest spiked: now, in the April 9 – April 15 2017 week and in the November 6 – November 12 2016 week. In both cases: in April 2017 and in November 2016 we saw major tops in gold and the same is likely to be seen this time.
Summing up, at the first sight, the situation on the precious metals market appears to have become much more bullish based on the most recent price action, however, looking at these developments from a broader perspective, reveals that the recent upswings are likely to be just temporary. The analysis of the previous North-Korean-based price swings suggests that their implications will disappear relatively quickly. At the same time, the post-Labor-Day seasonality is likely to kick in, and since in almost all cases, huge declines in gold followed in the previous years, the same is very likely to happen this year. In particular, the two most important analogies (last year being the closest analogy and 2011 being the most significant year for the gold investors) suggest that the top is already in or is very likely to be in this week. The extremely high volume in gold that we saw last month confirms that and the same goes for the sudden increase in the interest in gold trading. Consequently, the outlook for the gold price in September 2017 doesn’t seem to be as bullish as many people expect it to be – the buying opportunity is quite likely still ahead.
If you haven’t already signed up to our free gold newsletter, it may be a good idea to do so now – you’ll stay updated on our free articles (including the follow-ups to the above article) and you’ll also get 7 days of free access to our premium daily Gold Alerts as a starting bonus. Sign up today.
Thank you.
Sincerely,
Przemyslaw Radomski, CFA
Founder, Editor-in-chief
Tools for Effective Gold & Silver Investments - SunshineProfits.com
Tools für Effektives Gold- und Silber-Investment - SunshineProfits.DE
* * * * *
About Sunshine Profits
Sunshine Profits enables anyone to forecast market changes with a level of accuracy that was once only available to closed-door institutions. It provides free trial access to its best investment tools (including lists of best gold stocks and best silver stocks), proprietary gold & silver indicators, buy & sell signals, weekly newsletter, and more. Seeing is believing.
Disclaimer
All essays, research and information found above represent analyses and opinions of Przemyslaw Radomski, CFA and Sunshine Profits' associates only. As such, it may prove wrong and be a subject to change without notice. Opinions and analyses were based on data available to authors of respective essays at the time of writing. Although the information provided above is based on careful research and sources that are believed to be accurate, Przemyslaw Radomski, CFA and his associates do not guarantee the accuracy or thoroughness of the data or information reported. The opinions published above are neither an offer nor a recommendation to purchase or sell any securities. Mr. Radomski is not a Registered Securities Advisor. By reading Przemyslaw Radomski's, CFA reports you fully agree that he will not be held responsible or liable for any decisions you make regarding any information provided in these reports. Investing, trading and speculation in any financial markets may involve high risk of loss. Przemyslaw Radomski, CFA, Sunshine Profits' employees and affiliates as well as members of their families may have a short or long position in any securities, including those mentioned in any of the reports or essays, and may make additional purchases and/or sales of those securities without notice.
Przemyslaw Radomski Archive |
© 2005-2022 http://www.MarketOracle.co.uk - The Market Oracle is a FREE Daily Financial Markets Analysis & Forecasting online publication.