


Ethereum (ETH/USD) – bullish breakout of large symmetrical triangle looks to be getting closer
Currencies / Ethereum Nov 16, 2017 - 10:25 AM GMTBy: MarketsToday

 Long-term bullish setup
- Short-term bullish setup
- Bull trend continuation entry setting up for short-term
Low volatility leads to higher volatility
Since June, volatility in Ethereum (ETH/USD) has been declining with a potentially bullish multi-month symmetrical triangle consolidation pattern forming over that time. Keep in mind that low volatility leads to higher volatility.
The pattern seen on the daily chart can also be looked at as a bullish pennant trend continuation pattern on a weekly chart. Either way, since this classic consolidation pattern follows a greater than 6900% rally in 6 months, starting from the December 2016 low, the odds favor an eventual resolution to the upside. At the same time we always must be prepared for the opposite, a breakdown in this case.
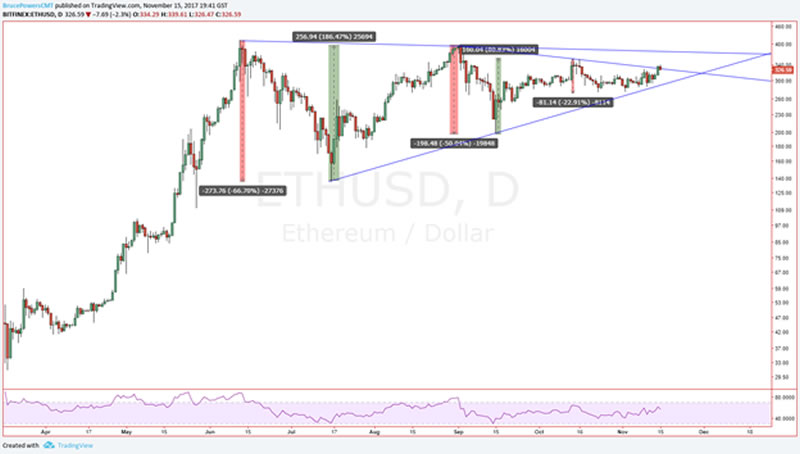
Ethereum is getting closer to the apex of the triangle and we can therefore anticipate that a breakout should occur within 2-3 weeks, if the triangle retains its integrity. After that the validity of the pattern becomes in doubt if a breakout has not yet occurred. Ideally, a breakout would occur this week or next, given where price is now relative to the apex.
Short-term outlook
Nevertheless, the above analysis is also important for the short-term outlook since ETH is inside a narrowing consolidation range and therefore follow-through is likely to continue to be diminished until a breakout of the larger pattern and therefore dominant pattern, occurs.
Since the triangle is an obvious pattern to anyone with basic technical analysis knowledge, we also need to anticipate the possibility of a sharp drop to the downside initially that can shake out weak holders before an upside breakout kicks in, if it is to do so. There’s no way to know if this type of price action will happen but we don’t want to be too surprised if it does.
Breakout potential
If ETH does breakdown then watch for potential entry points to take advantage of a subsequent potential rally back into the pattern in preparation of an upside breakout. Support of the pattern is currently identified with a prior swing low around 273.50. At that point ETH would be below the uptrend line.
This is an aggressive engagement technique and caution is advised as a drop below the trend line is generally considered to be bearish, and it might turn out that way. So, be clear on your trade plan and risk management strategy, and know what would need to happen for you to turn bearish instead.
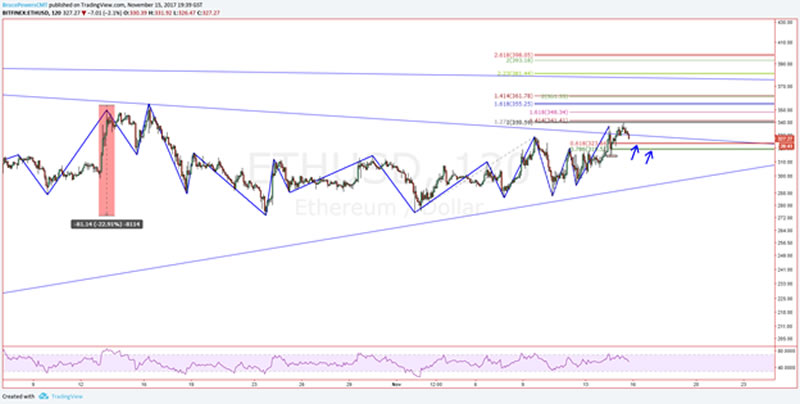
On the upside, the higher downtrend line (top line of triangle) gives us a potential target for a long position in the near-term. Note that in the enclosed 2-hour chart that ETH has already broken above the internal downtrend line (short-term bullish). In addition, the prior swing high of 328.8 has been exceeded thereby triggering a continuation of the uptrend on multiple time frames.
Even though the top of the triangle is up around roughly 375, there are other lower potential targets of resistance from Fibonacci ratio analysis. These can be seen on the enclosed intraday charts.
Bull trend continuation
Over the past four days or so an uptrend has been developing within a larger uptrend. Zig Zag lines have been added to the chart for visual clarity. The Fibonacci levels on the chart are possible targets for the current short-term uptrend before it becomes exhausted.
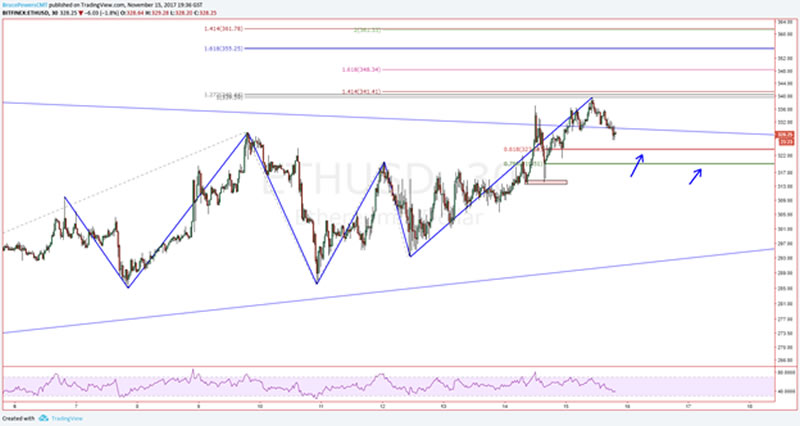
For a bull trend continuation entry we can zoom in further to the 30-min. chart to look at possibilities during a pullback. On this time frame the most recent swing low is at 314, and therefore below there where one might place a protective stop. If waiting for a pullback to the 61.8% Fibonacci retracement the target entry would be around 323.84, and if lower, near the 78.6% Fibonacci retracement the entry would be around 319.51.
Bruce Powers, CMT
Chief Technical Analyst
http://www.marketstoday.net/
© 2017 Copyright Bruce Powers- All Rights Reserved
Disclaimer: The above is a matter of opinion provided for general information purposes only and is not intended as investment advice. Information and analysis above are derived from sources and utilising methods believed to be reliable, but we cannot accept responsibility for any losses you may incur as a result of this analysis. Individuals should consult with their personal financial advisors.
© 2005-2022 http://www.MarketOracle.co.uk - The Market Oracle is a FREE Daily Financial Markets Analysis & Forecasting online publication.