Is the United States In Recession?
Economics / Recession 2008 - 2010 Sep 16, 2008 - 02:10 PM GMTBy: Paul_L_Kasriel

 At every FOMC meeting this year at least one voting member has dissented from the majority. The dissenter or dissenters either objected to the federal funds interest rate reductions implemented earlier in the year or wanted to increase the interest rate when the majority voted to keep the rate unchanged. The major reason for these FOMC dissents was a belief that Fed policy was too accommodative and, thus, would fan the flames of consumer price inflation. On the eve of the September 16 FOMC meeting, we believe that it is time for these FOMC hawks to “eat crow.”
Oxygen is to fire as credit is to consumer price inflation. A fire cannot continue to burn without oxygen and consumer inflation cannot continue to increase without credit creation. Because of deflation in the price of assets, credit is now being constrained. And the constraint in the creation of credit is about to reduce the rate of consumer price inflation.
The financial system is experiencing large credit-related losses. These losses are eroding the capital of the financial system. As capital erodes, the financial system is constrained in the amount of new credit it can create, especially for the private sector. Even if the Federal Reserve is offering cheap credit to the financial system, a financial system that is capital constrained will not avail itself of the Fed’s cheap credit because it does not have the capital to support more credit creation.
We will have to wait until Thursday, September 18, for the release of the Fed’s second-quarter flow-of-funds data to determine what has happened to various measures of non-bank credit. But the Fed provides us with weekly and monthly observations of commercial bank credit. And the recent behavior bears out what we discussed in the paragraph above. Chart 1 shows that there has been a sharp slowdown in commercial bank credit creation in recent months. After growing at an annualized rate of 22.6% in the three months ended October 2007, commercial bank credit to the private sector contracted at an annualized rate of 1.0% in the three months ended August 2008.
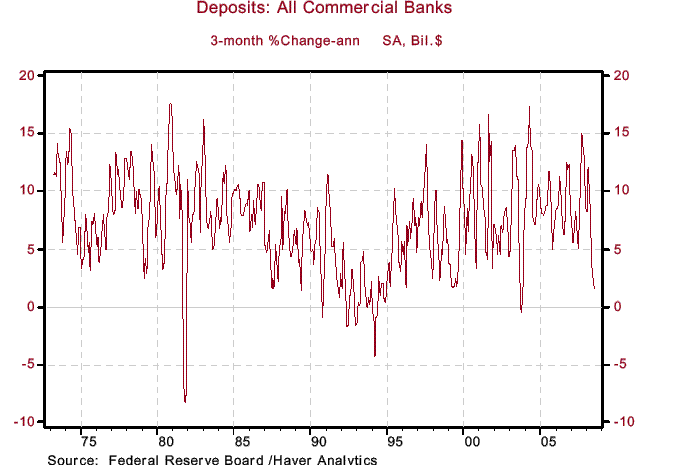
If growth in the assets of the commercial banking system has slowed or is contracting, then, according to double-entry bookkeeping, the liabilities of the banking system also must be behaving in the same fashion. A large part of commercial bank liabilities are deposits. So, we would expect to observe a sharp slowdown in commercial bank deposit growth when commercial bank credit slows sharply. Sure enough, the data in Chart 2 bear this out. After growing at an annual rate of 15.1% in the three months ended October 2007, annualized growth in commercial bank deposits slowed to only 1.5% in the three months ended August 2008. In sum, the contraction in bank credit and the sharp slowdown in the growth of bank deposits, if continued, will serve to suppress consumer price inflation going forward.
Chart 1
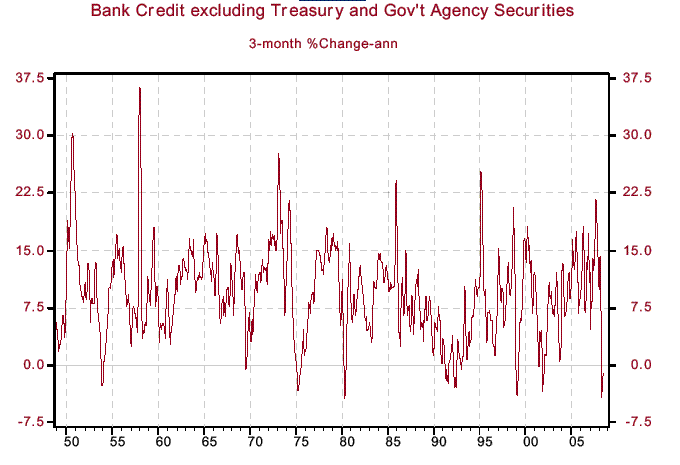
Chart 2
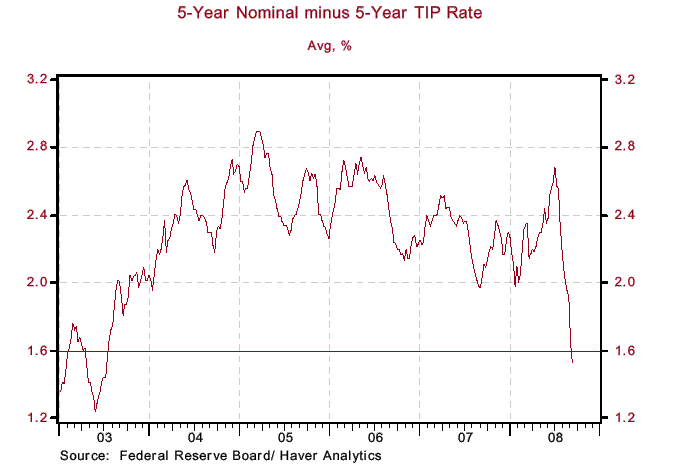
Don’t believe us? Do you believe the verdict of the financial markets, which are generally agreed to be forward looking? The bond market’s expectation of consumer price inflation over the next five years has plunged to about 1.5% in recent weeks from almost 2.7% in early July (see Chart 3).
Chart 3
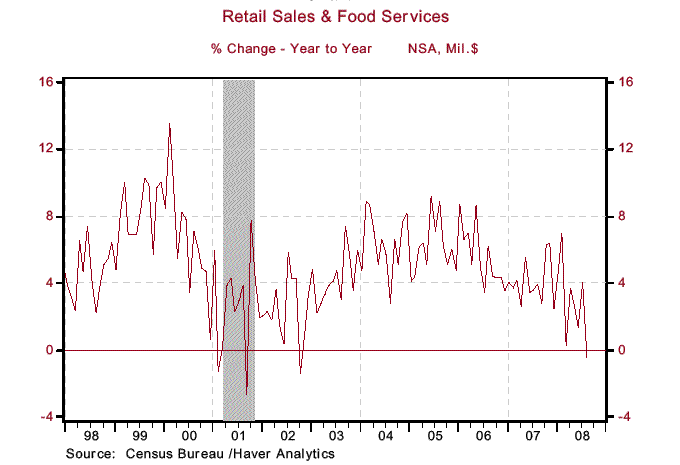
The sharp slowing in bank credit and deposit growth also is having a retarding impact on aggregate demand. In August, nominal retail sales were down 0.4% from August 2007 – the first year-over-year decline in nominal retail sales since October 2002 (see Chart 4). It is highly likely that price-adjusted total consumer spending on goods and services will contract in this third quarter vs. the second quarter – the first contraction in real consumer spending since the fourth quarter of 1991.
Chart 4
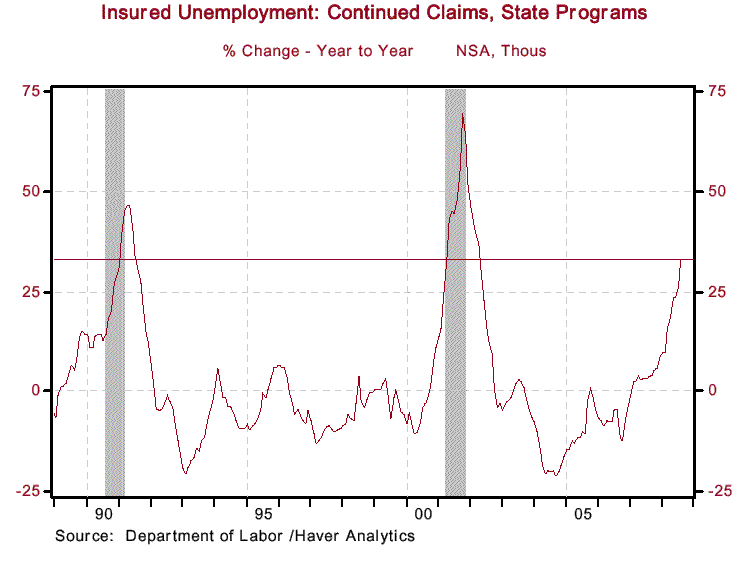
Quite naturally, when growth in aggregate demand slows, so, too, does the demand for labor. In August 2008, the number of real people standing in real lines (in contrast to the mythical people conjured up by the Bureau of Labor Statistics’ birth/death models) was up 32.9% from August 2007 (see Chart 5).
Chart 5
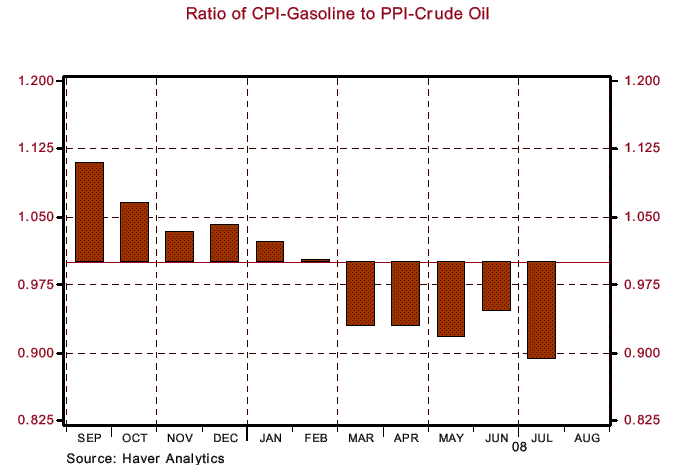
We mention this slowing in the growth of aggregate demand and labor to bring up a point relative to inflation. When demand for a product or a production factor input is weakening, it is difficult for the producers of that product or the owners of that production factor input to increase the price of the product or factor input. An example of this can be found with regard to the relationship between the retail price for gasoline and the price of crude oil. Chart 6 shows the recent behavior of the ratio between the gasoline price index of the CPI and the crude oil price index of the crude-goods PPI. Notice that starting in March of this year, this ratio fell below 1.00, indicating that the price of crude oil was rising faster than the retail price of gasoline.
This suggests that oil refiners were unable to pass on to retail gasoline purchasers the full increase in the price of crude oil because household demand for many goods and services was falling, including the demand for gasoline. (For you Econ 101 students out there, the demand curves for gasoline and other goods and services were shifting back relative to the supply curves.) If producers of a necessity such as gasoline are having trouble passing on their increased costs, what do you think is happening to the pricing power of producers of discretionary goods and services? If the demand for labor is falling, what chance do you think workers in general have in negotiating a faster increase in their nominal wages?
Chart 6
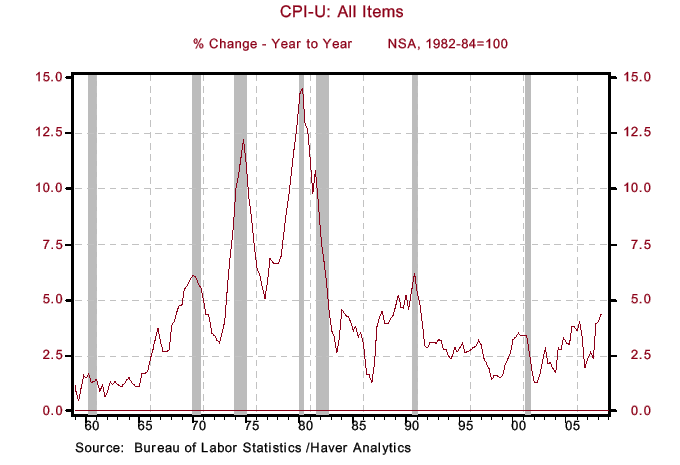
Inflation is a lagging economic indicator. First growth in aggregate demand slows and then producers are unable to continue to receive price increases at the same pace prior to the slowdown in aggregate demand. As Chart 7 illustrates, first the U.S. economy enters a recession (indicated by the shaded areas) and after the onset of recession, consumer price inflation moderates. We are confident that this business cycle will be no different.
Chart 7
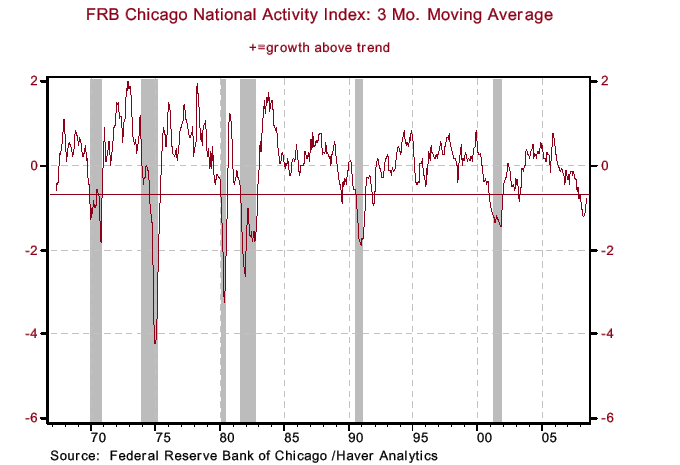
Has the U.S .economy entered a recession? Well, the arbiter of this determination, a group of economists at the nonprofit National Bureau of Economic Research, has not yet made its call. The group typically does not make its call until the economy is well into the recession. But the growing body of evidence strongly suggests that a recession has begun. The four components of the Conference Board’s index of coincident economic indicators – nonfarm payrolls, industrial production, real personal income excluding government transfer payments and real business sales – all appear to have put in a definitive cycle peak. We use the term “appear” because only with the passage of time can we know if a definitive peak has been established. In addition, these data get revised repeatedly. Of course, the index of leading economic indicators has been foretelling the onset of recession since 2007.
Has the U.S .economy entered a recession? Well, the arbiter of this determination, a group of economists at the nonprofit National Bureau of Economic Research, has not yet made its call. The group typically does not make its call until the economy is well into the recession. But the growing body of evidence strongly suggests that a recession has begun. The four components of the Conference Board’s index of coincident economic indicators – nonfarm payrolls, industrial production, real personal income excluding government transfer payments and real business sales – all appear to have put in a definitive cycle peak. We use the term “appear” because only with the passage of time can we know if a definitive peak has been established. In addition, these data get revised repeatedly. Of course, the index of leading economic indicators has been foretelling the onset of recession since 2007.
Chart 8
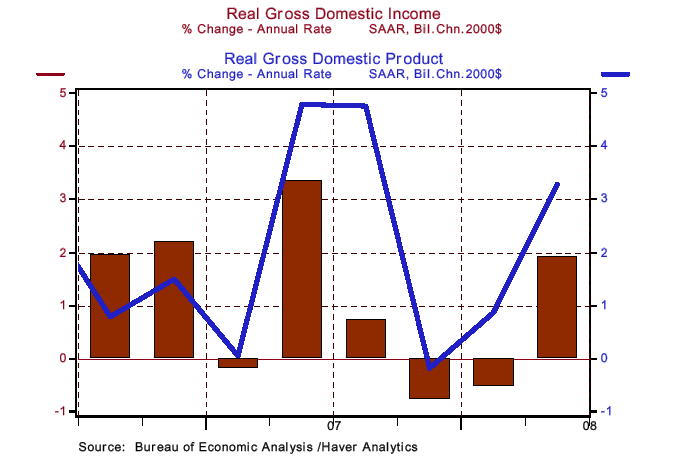
GDP measures the amount of goods and services produced in the economy. GDP can be calculated either from the expenditures side – personal consumption, business investment, etc. – or from the income side – personal income, corporate profits, etc. Income is generated for someone with the production of goods and services. In theory, the GDP calculation from toting up total expenditures should equal the GDP calculation from toting up all income generated. But in practice, there almost always is a differential between the two. In the past year, there is a rather significant discrepancy, with real GDP calculated from the expenditures side outpacing real GDP from the income side.
Chart 9 shows real gross domestic income has contracted for two consecutive quarters – in the fourth quarter of last year as well as the first quarter of this year – thus fulfilling the “CNBC” definition of a recession. Real gross domestic product contracted in the fourth quarter of last year but grew in the first quarter of this year. Notice also that there was a significant growth differential between the two in the second quarter of this year – 3.3% for real gross domestic product vs. 1.9% for gross domestic income. The preponderance of other data, such as the index of coincident economic indicators, supports the message being sent by gross domestic income – i.e., the economy has entered a recession.
Chart 9
In sum, the economy has entered a recession and is unlikely to emerge from this recession until the second half of 2009. That emergence will be difficult to distinguish from the recession itself. That is, the recovery will be muted because of the financial system’s inability to create much credit for the private sector. On a cyclical basis, consumer price inflation has peaked. Aggregate demand is contracting and the flow of oxygen to inflation, credit creation, is and will remain constrained. It is time for the Fed chef to prepare a crow dish for the FOMC hawks.
By Paul L. Kasriel
The Northern Trust Company
Economic Research Department - Daily Global Commentary
Copyright © 2008 Paul Kasriel
Paul joined the economic research unit of The Northern Trust Company in 1986 as Vice President and Economist, being named Senior Vice President and Director of Economic Research in 2000. His economic and interest rate forecasts are used both internally and by clients. The accuracy of the Economic Research Department's forecasts has consistently been highly-ranked in the Blue Chip survey of about 50 forecasters over the years. To that point, Paul received the prestigious 2006 Lawrence R. Klein Award for having the most accurate economic forecast among the Blue Chip survey participants for the years 2002 through 2005.
The opinions expressed herein are those of the author and do not necessarily represent the views of The Northern Trust Company. The Northern Trust Company does not warrant the accuracy or completeness of information contained herein, such information is subject to change and is not intended to influence your investment decisions.
Paul L. Kasriel Archive |
© 2005-2022 http://www.MarketOracle.co.uk - The Market Oracle is a FREE Daily Financial Markets Analysis & Forecasting online publication.


