


Recession Probabilities Continue to Increase: What’s Next for Stock Market
Stock-Markets / Stock Markets 2019 Jun 05, 2019 - 12:49 PM GMTBy: Troy_Bombardia

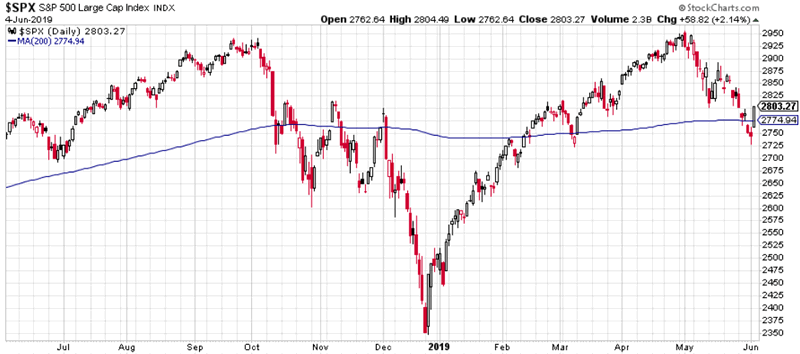
 The stock market rallied above its 200 day moving average today along with Fed-related news. Today’s headlines:
- The New York Fed’s Recession Probability Model continues to increase
- Today’s spike saw relatively low volume
- Stocks spiked, but VIX didn’t fall significantly today
- 30 year – 2 year Treasury yield is steepening
- PMI and the S&P are both falling
- Zahorchak Method isn’t falling
Go here to understand our fundamentals-driven long term outlook. For reference, here’s the random probability of the U.S. stock market going up on any given day.

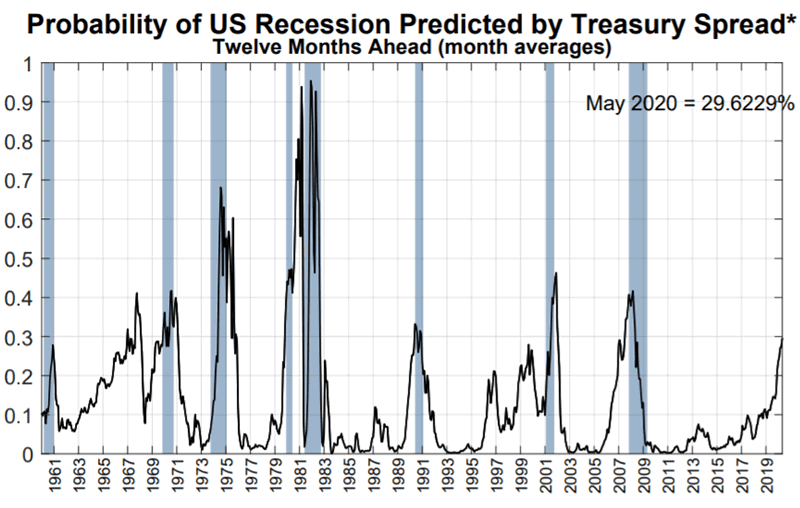
New York Fed Recession Probability Model
The New York Fed has a Recession Probability Model that uses the 10 year – 3 month Treasury yield.
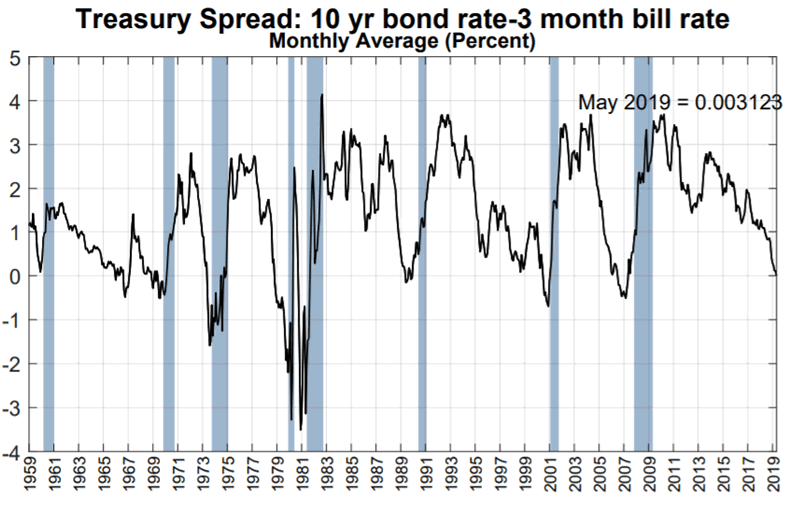
Here’s the model, which is currently above 29%
Here’s what happens next to the S&P when the probability of a recession exceeds 29%, according to the New York Fed’s model.
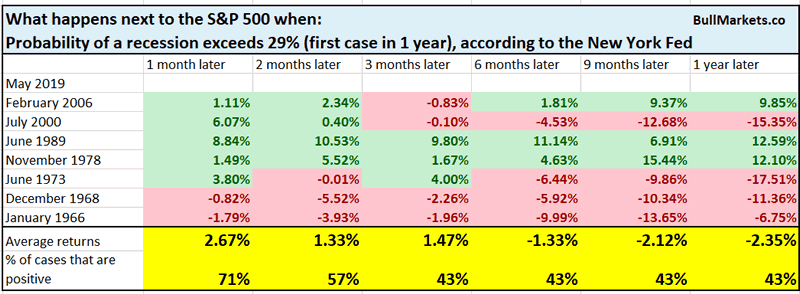
Long term forward returns are less bullish than random. This is a late-cycle sign. Let’s examine some of the cases.
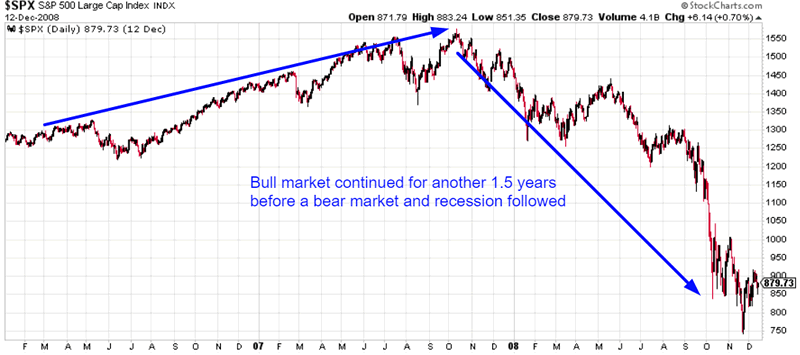
February 2006: bull market and economic expansion continued for another 1.5 years
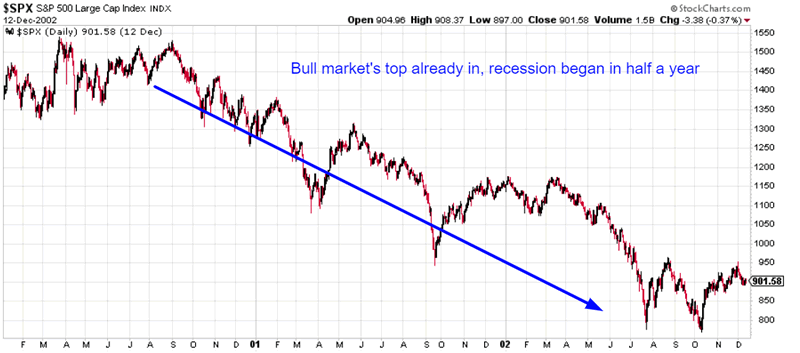
July 2000: bull market already over
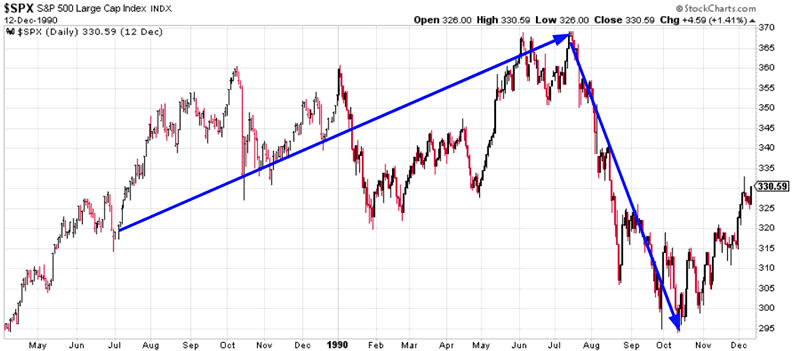
June 1989: economic expansion continued for another 1 year, followed by a -20% decline in the stock market
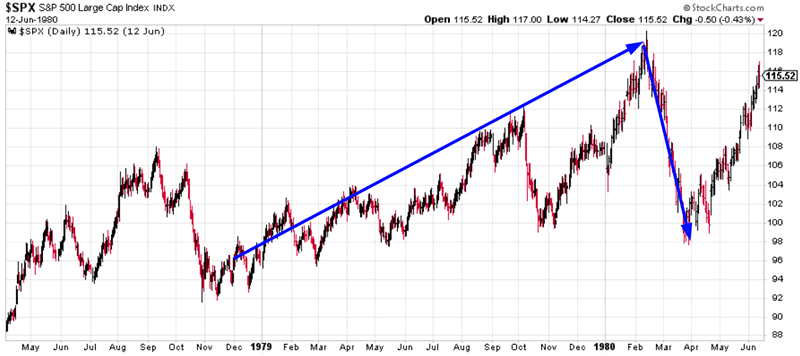
November 1978: economic expansion continued for more than 1 year, followed by a recession and a -20% stock market decline.
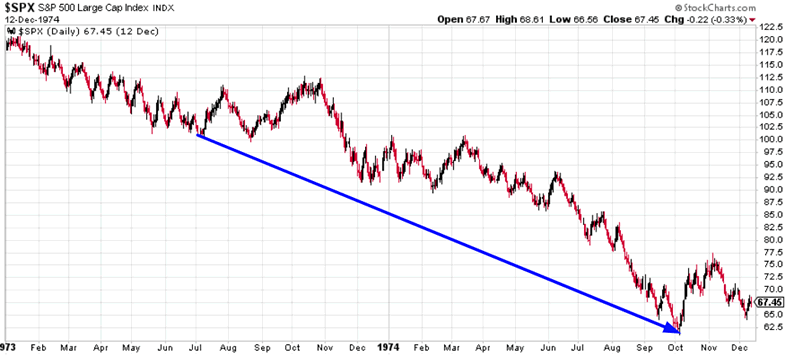
June 1973: A bear market had already begun
Either way, this is late-cycle. Would I use this for trading?
No. The yield curve is just one of many macro points to consider.
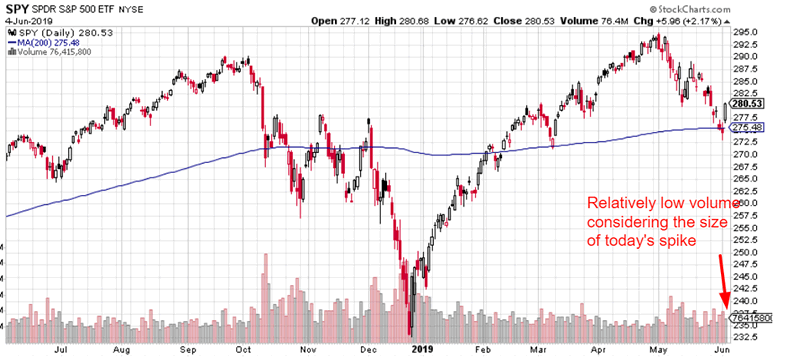
Today’s spike saw relatively low volume
While the S&P spiked more than 2% today, SPY’s volume was less than its 1 year average. (SPY = S&P 500 ETF).
Is this normal? Should sustainable spikes see more volume?
Here’s what happens next to the S&P when SPY surges more than +2% and is above its 200 dma, but volume is more than -15% below its 1 year average.
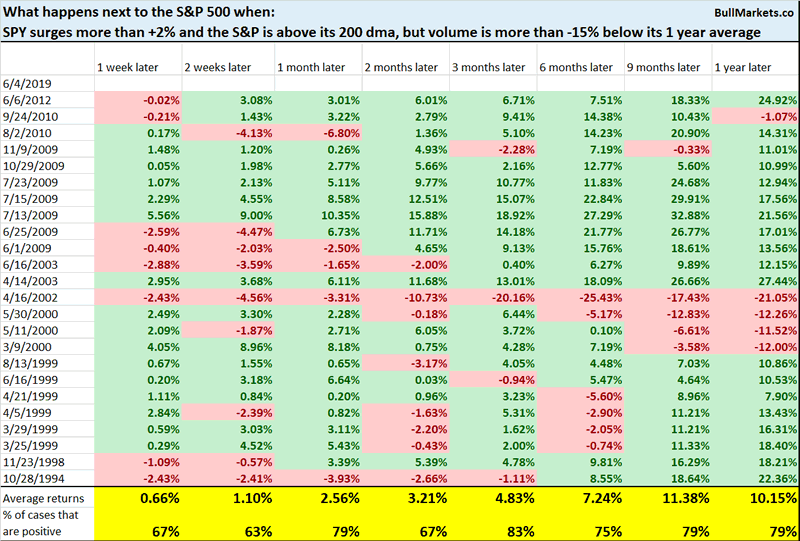
Mostly bullish 3 months later.
VIX’s muted reaction
While the S&P rallied more than 2% today, VIX fell less than -11%. This is uncommon, because big 1 day S&P rallies usually lead to a bigger VIX decline. A 2% S&P rally usually = a -20% to -30% VIX decline.
Here’s what happens next to the S&P when VIX falls less than -11%, while the S&P rallies more than 2% and is above its 200 dma.
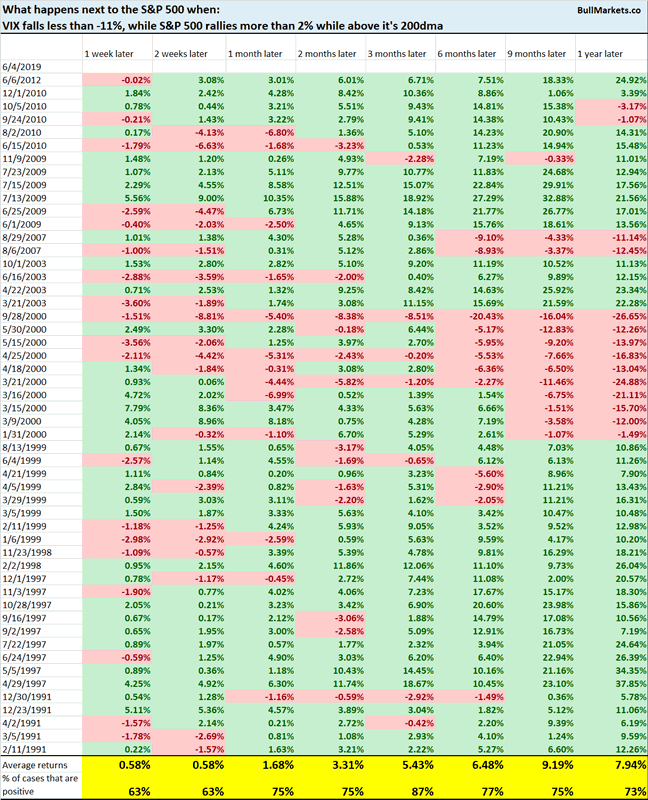
Once again, mostly bullish for the S&P 3 months later.
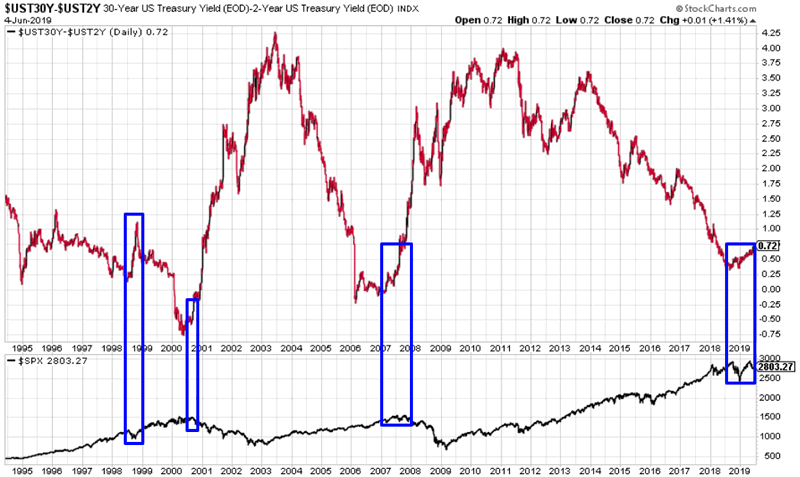
30 year – 2 year Treasury yield is steepening
While the 10 year – 3 month yield curve has been pushing deeper into inversion over the past few months, longer term parts of the yield curve have been steepening (e.g. 30 year – 5 year and 30 year – 2 year).
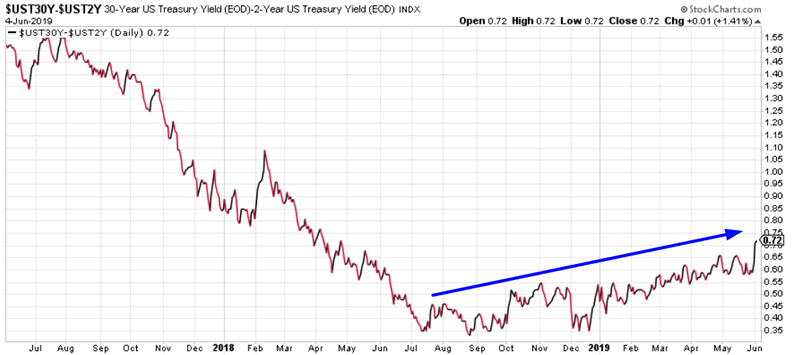
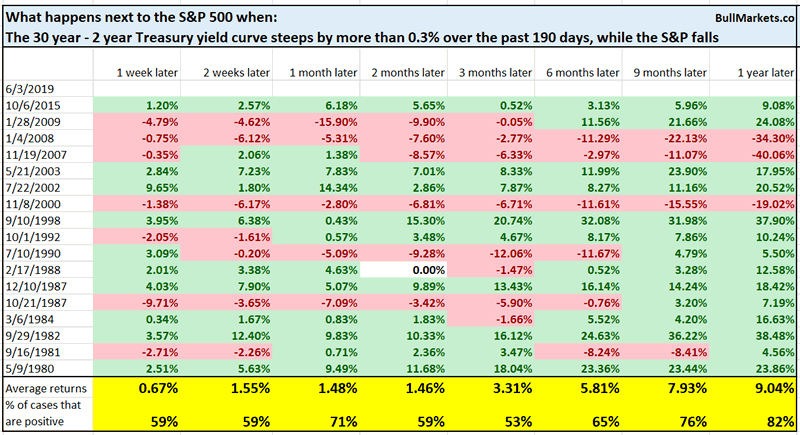
Here’s what happens next to the S&P when the 30 year – 2 year yield curve steepens by more than 0.3% over the past 190 days, while the S&P falls
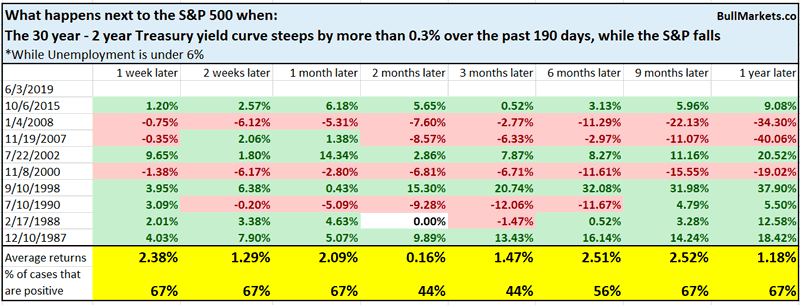
What if we only want to look at late-cycle cases, in which unemployment is under 6%?
What if we want to shrink the parameters even more and only look at cases in which Unemployment is under 5%?
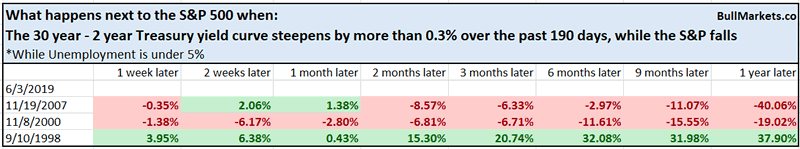
In a best case scenario, this bull market has 1 year left
ISM manufacturing PMI
In terms of macro, the 3 main weak points center around:
- Yield curve
- Trade-related sectors (trade war)
- Manufacturing
The other macro sectors are decent.
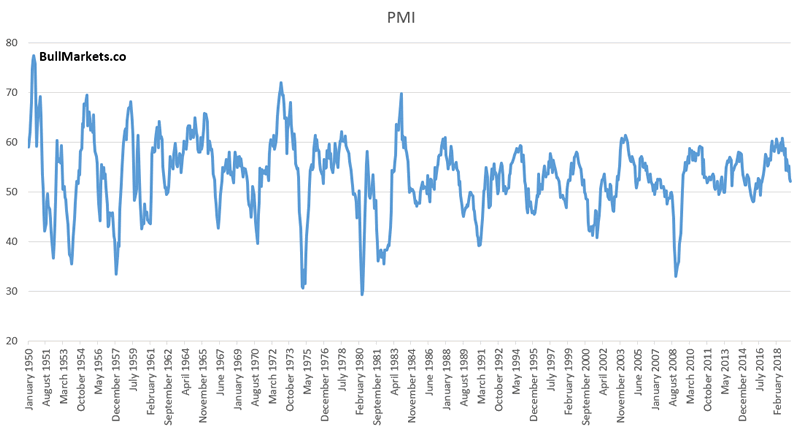
The ISM manufacturing PMI has been falling over the past 9 months.
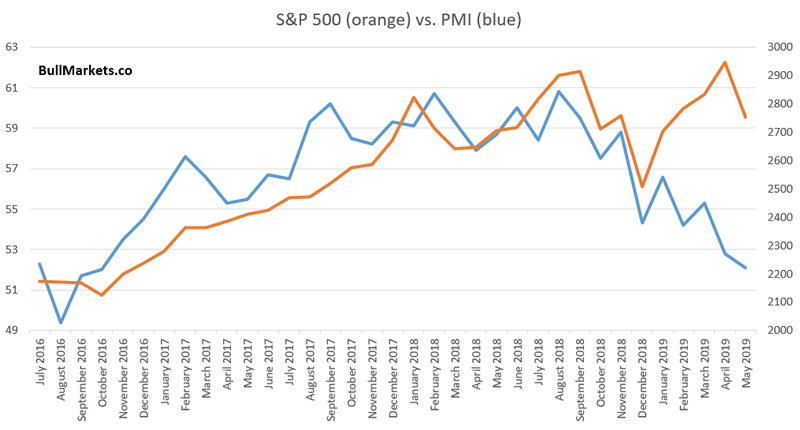
I usually dislike these charts because “divergences” don’t mean much. The PMI by definition spends half of its time going up and half of its time going down. Since the stock market goes up > 50% of the time, most “divergences” aren’t useful as timing indicators.
However, there is something to be said about a deterioration in the PMI while the S&P is also going down. In other words
- Not every decline in PMI is bearish for stocks
- But when PMI and stocks decline together, that is not a bullish sign
Here’s what happens next to the S&P when PMI falls more than -8 over the past 9 months, while the S&P also falls more than -5%
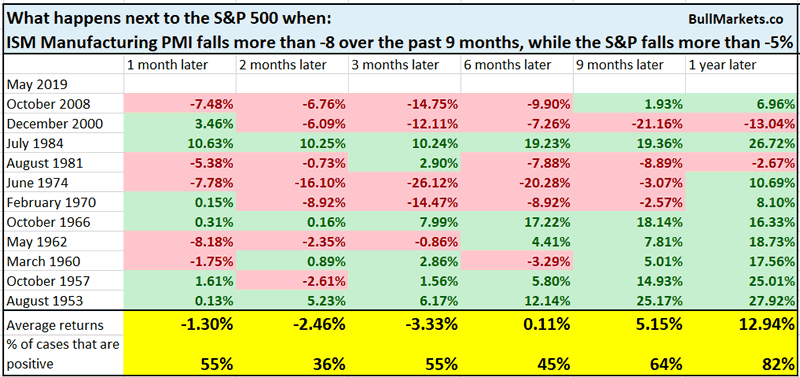
Manufacturing remains a weak point for macro over the next 6 months.
Zahorchak
The Zahorchak Method is a trend following indicator that combines price action trend following with breadth.
With the S&P falling over the past few weeks, you would expect that the Zahorchak Method falls as well. It hasn’t.
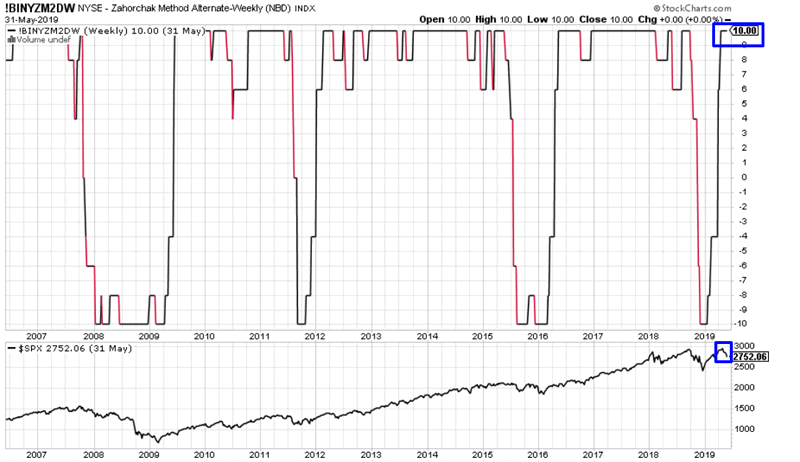
Is this a bullish factor for the S&P?
Here’s what happens next to the S&P when it falls more than -4% over the past 4 weeks, while the Zahorchak Method is still at 10.
*The latest reading “5/27/2019” is as of last Friday’s close.
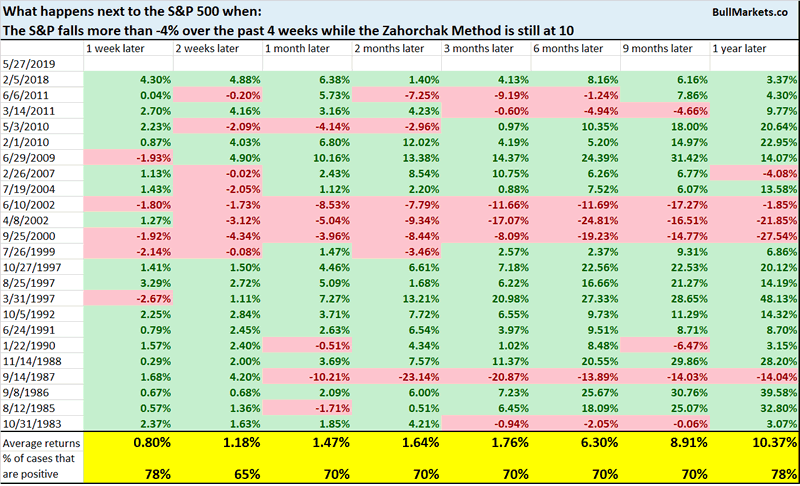
Slightly more bullish than random over the next few weeks.
We don’t use our discretionary outlook for trading. We use our quantitative trading models because they are end-to-end systems that tell you how to trade ALL THE TIME, even when our discretionary outlook is mixed. Members can see our model’s latest trades here updated in real-time.
Conclusion
Here is our discretionary market outlook:
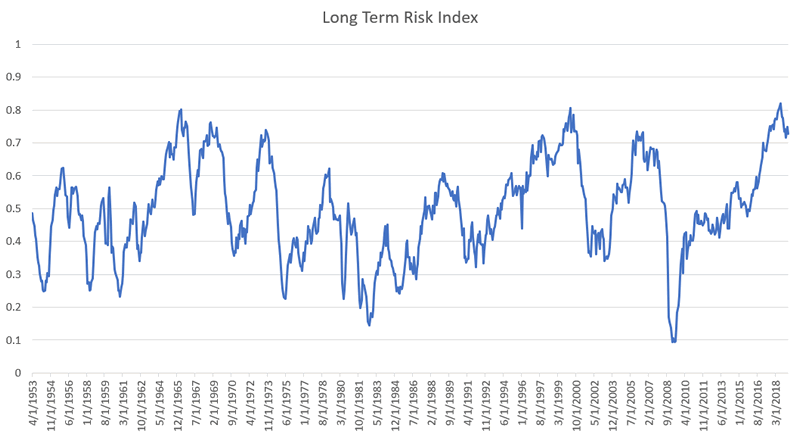
- The U.S. stock market’s long term risk:reward is not bullish. In a most optimistic scenario, the bull market probably has 1 year left.
- Most of the medium term market studies (e.g. next 6-9 months) are bullish, although a few of trend following studies are starting to become bearish.
- Market studies over the next 1-2 weeks are mixed (some bullish and some bearish). Trade war news only adds to this uncertainty.
- HOWEVER, our market studies for the next 1-3 months are starting to turn more bullish.
- We focus on the medium-long term.
Goldman Sachs’ Bull/Bear Indicator demonstrates that risk:reward does favor long term bears.
Click here for more market analysis
By Troy Bombardia
I’m Troy Bombardia, the author behind BullMarkets.co. I used to run a hedge fund, but closed it due to a major health scare. I am now enjoying life and simply investing/trading my own account. I focus on long term performance and ignore short term performance.
Copyright 2019 © Troy Bombardia - All Rights Reserved
Disclaimer: The above is a matter of opinion provided for general information purposes only and is not intended as investment advice. Information and analysis above are derived from sources and utilising methods believed to be reliable, but we cannot accept responsibility for any losses you may incur as a result of this analysis. Individuals should consult with their personal financial advisors.
Troy Bombardia Archive |
© 2005-2022 http://www.MarketOracle.co.uk - The Market Oracle is a FREE Daily Financial Markets Analysis & Forecasting online publication.