


What Are The Real Upside Targets For Crude Oil Price Post Drone Attack?
Commodities / Crude Oil Sep 17, 2019 - 03:03 PM GMTBy: Chris_Vermeulen

 After the news of the drone attack on the Saudi Arabia oil refinery, traders knew this week would be full of bigger price moves, reversals and some real opportunity for profits. We were also well aware of the risks of engaging in these market moves prior to fully understanding the dynamics of this event. We heard from many of our friends in the industry about open positions that were not properly scaled to deal with risk – and we know some of our friends took a hit early today.
The real questions before skilled technical traders are:
What will happen with Oil and where will price find the first level of resistance?
What will happen to the US and foreign major markets related to this supply disruption?
How will future economic expectations react to this disruption?
How can I profit from these moves? First, opt-in to our Free Trade Ideas Newsletter Here!
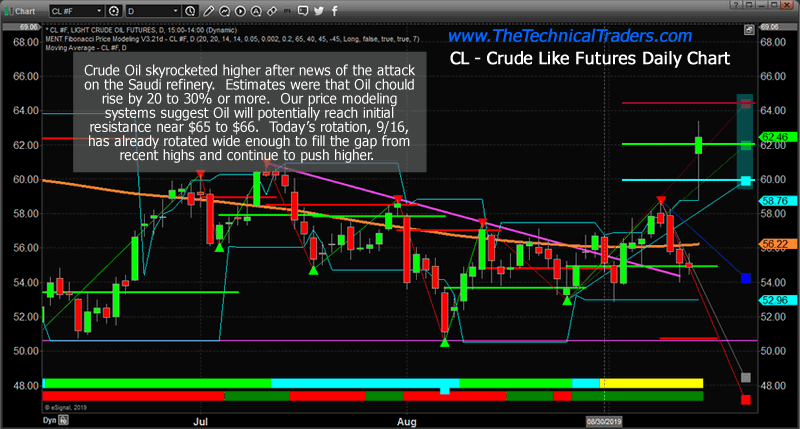
We can answer the first question fairly easily – where is the first level of resistance? The shorter-term resistance resides at $64.41 ($64.50 to $66). The longer-term resistance resides at $71.35 ($71.50 to $72.50). This means the price of oil should run into some moderate resistance near $65. If it breaks past that level, then the next level of resistance is near $72.
The second question is a bit more complicated to answer. We believe the US markets will continue to benefit from the capital shift that has continued to take place over the past 4+ years and from deep US oil supply capabilities and reserve capabilities. Foreign markets, particularly those that are dependent on oil imports, may experience a new impulse of economic weakness as oil costs rise. Exporting countries will see new revenues to support ailing policies. The answer is, the more mature economies will survive without much trouble – weaker, less mature, economies could experience some real pain from this move in Oil.
The third question is open to interpretation as foreign currencies continue to shift. Initially, any country that is dependent on oil imports will experience some real future expectation economic pain. Countries that are in a more stable position regarding Oil demands could still experience some pain as currencies shift valuations. Overall, the length of this disruption and the possibility of any further supply disruption is really where these future expectations come unglued. The opportunity for further disruptions or future changes in market dynamics is very real. This is a very “fluid” process at the moment.
Profiting from these moves is really quite simple – patience, wait for the right setups, confine risks and make sure you already have your hard cash reserves and protection positions in precious metals. These swings in the markets are going to get better and bigger as this continues to play out. Skilled technical traders will have no shortage of great trade opportunities throughout the next 15+ months.
Daily Crude Oil Price Chart
This Daily Oil chart highlights our proprietary Fibonacci price modeling system and the key upside price target (resistance) near $64.50. Ultimately, this is the upper resistance level that is the first level of major resistance for this upside price move in Oil. Rotation within these three Fibonacci target ranges has already started to happen. This suggests price volatility is massive in oil and should continue in the near future.
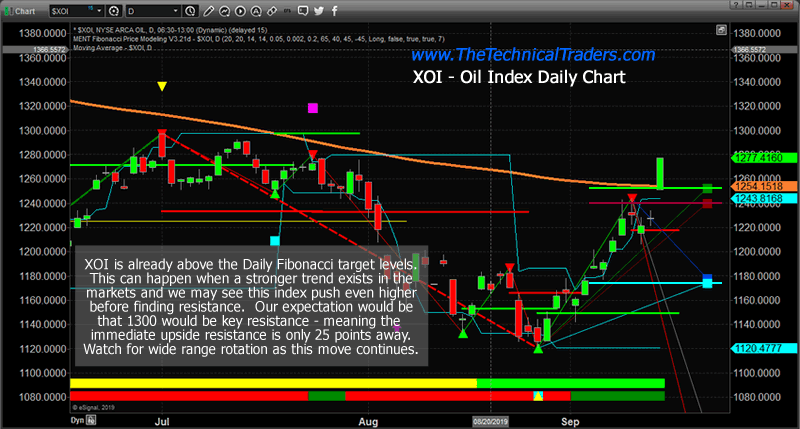
Daily XOI Oil Stock Index Chart
This Daily XOI chart highlights the Daily Fibonacci price targets and clearly shows how quickly price has rallied after the weekend. The XOI price is already above the three Fibonacci price targets, thus we must revert to previous price PEAKS as new resistance levels. Currently, the 1300 level is a key resistance level which would closely align with our $64.50 level in Crude.
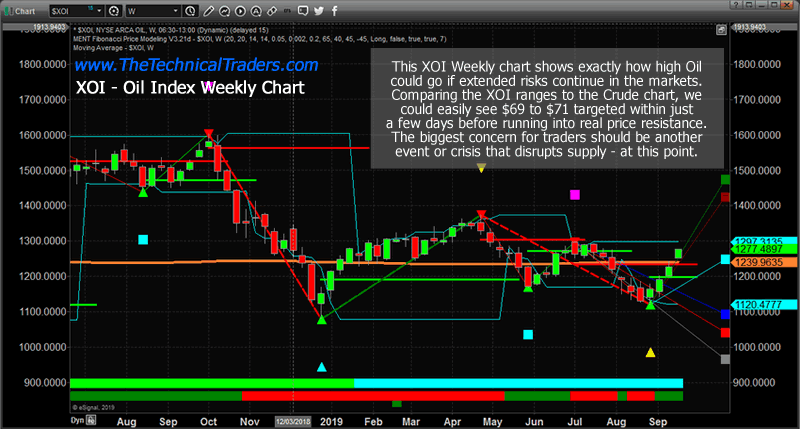
Weekly XOI Oil Stock Index Chart
This XOI Weekly chart provides a longer-term picture of the upside targets in XOI. The upper targets near 1425 and 1475 would translate into a $69 to $71 price target in Crude Oil. Therefore, any breakout above $66~67 could easily rally up to $69 to $71 before reaching any key resistance levels.
Concluding Thoughts:
If the XOI is unable to clear the $1302 level, then this upside move in Crude Oil may actually be over as fast as it started. Failure to climb above $1302 in XOI would result in a complete “new price high” failure and would suggest a top is forming.
We love it when the markets move like this. Quite honestly, these are the best conditions for skilled technical traders to find extremely profitable trade setups. The most difficult part of trading in this type of market is protecting against risk and position sizing. If you are ready to learn where new trade setups are forming like in gold miners, and metals and want to execute trades effectively within this volatile rotation then check out my ETF trading newsletter.
I urge you visit my Wealth Building Newsletter and if you like what I offer, join me with the 1 or 2-year subscription to lock in the lowest rate possible and ride my coattails as I navigate these financial market and build wealth while others lose nearly everything they own during the next financial crisis. Join Now and Get a Free 1oz Silver Round or Gold Bar!
I can tell you that huge moves are about to start unfolding not only in metals, or stocks but globally and some of these supercycles are going to last years. A gentleman by the name of Brad Matheny goes into great detail with his simple to understand charts and guide about this. His financial market research is one of a kind and a real eye-opener. PDF guide: 2020 Cycles – The Greatest Opportunity Of Your Lifetime
As a technical analysis and trader since 1997, I have been through a few bull/bear market cycles. I believe I have a good pulse on the market and timing key turning points for both short-term swing trading and long-term investment capital. The opportunities are massive/life-changing if handled properly.
Chris Vermeulen
www.TheTechnicalTraders.com
Chris Vermeulen has been involved in the markets since 1997 and is the founder of Technical Traders Ltd. He is an internationally recognized technical analyst, trader, and is the author of the book: 7 Steps to Win With Logic
Through years of research, trading and helping individual traders around the world. He learned that many traders have great trading ideas, but they lack one thing, they struggle to execute trades in a systematic way for consistent results. Chris helps educate traders with a three-hour video course that can change your trading results for the better.
His mission is to help his clients boost their trading performance while reducing market exposure and portfolio volatility.
He is a regular speaker on HoweStreet.com, and the FinancialSurvivorNetwork radio shows. Chris was also featured on the cover of AmalgaTrader Magazine, and contributes articles to several leading financial hubs like MarketOracle.co.uk
Disclaimer: Nothing in this report should be construed as a solicitation to buy or sell any securities mentioned. Technical Traders Ltd., its owners and the author of this report are not registered broker-dealers or financial advisors. Before investing in any securities, you should consult with your financial advisor and a registered broker-dealer. Never make an investment based solely on what you read in an online or printed report, including this report, especially if the investment involves a small, thinly-traded company that isn’t well known. Technical Traders Ltd. and the author of this report has been paid by Cardiff Energy Corp. In addition, the author owns shares of Cardiff Energy Corp. and would also benefit from volume and price appreciation of its stock. The information provided here within should not be construed as a financial analysis but rather as an advertisement. The author’s views and opinions regarding the companies featured in reports are his own views and are based on information that he has researched independently and has received, which the author assumes to be reliable. Technical Traders Ltd. and the author of this report do not guarantee the accuracy, completeness, or usefulness of any content of this report, nor its fitness for any particular purpose. Lastly, the author does not guarantee that any of the companies mentioned in the reports will perform as expected, and any comparisons made to other companies may not be valid or come into effect.
Chris Vermeulen Archive |
© 2005-2022 http://www.MarketOracle.co.uk - The Market Oracle is a FREE Daily Financial Markets Analysis & Forecasting online publication.