


Predictive Modeling Suggests US Stock Markets 12% Over Valued
Stock-Markets / Stock Markets 2020 May 27, 2020 - 11:05 AM GMTBy: Chris_Vermeulen

Our Adaptive Dynamic Learning (ADL) predictive modeling system has called some incredible moves over the past 24+ months. It predicted the moves in Gold moving from $1340 to $1750 – including many of the trend changes that took place over the past 15+ months. It predicted the collapse in Crude Oil back in July 2019 – even calling for a sub-$20 price collapse in March/April 2020. Overall, the abilities of this unique predictive modeling tool have been nothing short of incredible.
For many weeks, we’ve been suggesting the US stock market has entered a no man’s land after the bottom setup near March 20, 2020. The US Fed and global central banks have stepped in to attempt to support the markets and to take pressures off financial institutions and consumers. These efforts presented a very real opportunity for technical traders to attempt to “ride the Fed wave” over the past 3+ weeks. Right now, things appear to be a bit more fragile going forward into the Summer months and the ADL predictive modeling system is showing us what to expect.
One of the most important benefits of the ADL predictive modeling system is to identify “consensus” predictions of price activity looking forward in time. Sometimes, the ADL system makes very bold predictions – like the Crude Oil predictions. Other times the ADL system makes rather mundane predictions. Today, the ADL system is suggesting the US major indexes (and stock market) is about 10% to 15% overvalued and will attempt to revert back to fair valuation levels.
This prediction suggests that a downside price move, or price reversion, is likely to set up over the next few weeks where price level may fall to near (or below) the predicted ADL levels. When price reverts like this to a valuation level, it can sometimes move beyond the predicted price level before settling closer to the predicted ADL level. Price can also set up an “anomaly” pattern where it avoids the ADL predictive levels for a period of time, then aggressively reverts back to levels near the ADL predicted price levels. These anomalies can be really great trades for technical traders.
Before we continue, be sure to opt-in to our free-market trend signals before closing this page, so you don’t miss our next special report!
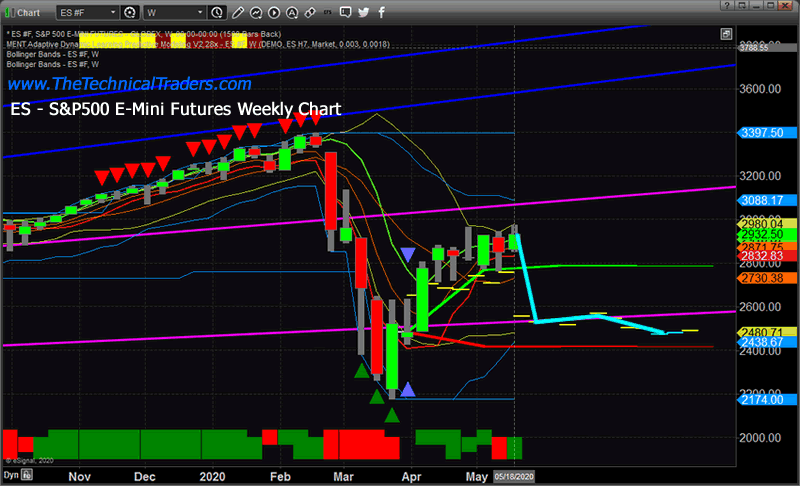
WEEKLY S&P500 E-MINI FUTURES ADL CHART
This weekly ES (S&P500 E-Mini Futures) ADL chart suggests a downside price reversion totaling more than 14% is very likely over the next 3+ weeks. Should the downside reversion extend below the CYAN predicted ADL levels, this move could result in a 20% or more downside price collapse.
Notice how the ADL predictive price levels flatten out over the next 8+ weeks. This suggests volatility may increase as price attempts to form a sideways FLAG or other extended patterns.
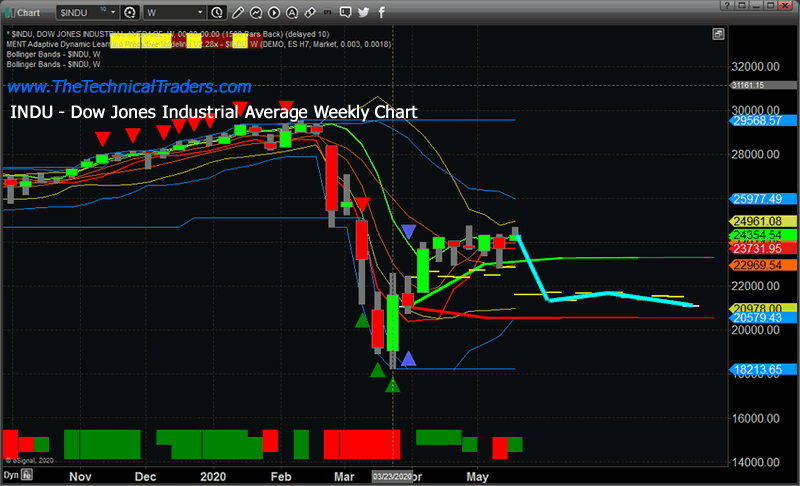
WEEKLY DOW JONES INDUSTRIAL ADL CHART
This Weekly INDU chart shows a similar ADL price prediction – an 11% to 13% downside price move followed by moderate downside price weakness over the next 8+ weeks. Pay very close attention to the 21,000 level which appears to be lower support based on the ADL predictions. We believe any downside move in the INDU could attempt to breach the 21,000 level as it attempts to find and establish future support.
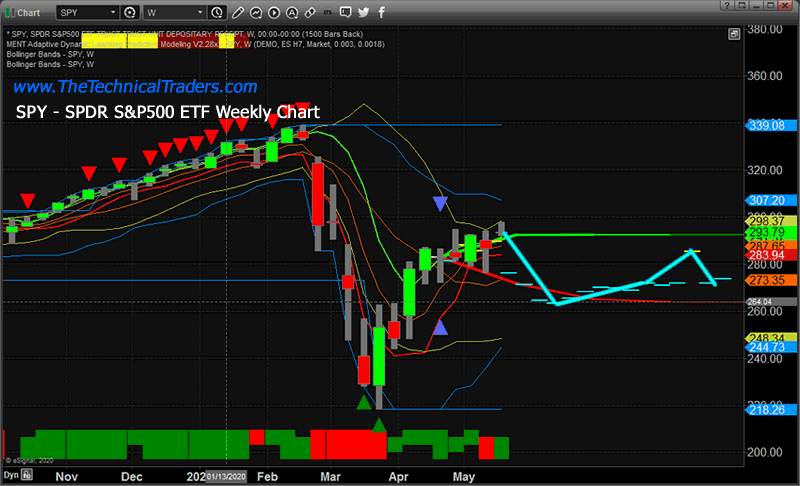
WEEKLY SPDR S&P500 ETF (SPY) ADL CHART
Lastly, this Weekly SPY ADL chart suggests a 13% to 15% downside price move is setting up which also suggests price may move beyond the lower ADL predictive ranges over the next 3+ weeks. If this happens, the SPY may collapse toward levels near $240~$245 (or lower) before finding any real support and moving back towards the ADL predictive price levels.
If you’ve been following our research and articles, you already know we’ve been warning about a “double-dip” move in the stock market and have also been advising readers to stay prepared for the incredible swings that are about to happen in the markets in 2020 and 2021. Our research team issued a Black Swan warning on February 21, 2020 – just days before the start of a collapse in the US stock market. We’d been warning about the setup and potential for this Black Swan event for nearly 5+ weeks before it happened.
This current ADL predictive modeling research suggests the US stock market will likely stall through the Memorial holiday weekend and begin next week with a measurable downside price bias – starting the move towards the lower ADL predicted levels. Now is the time to prepare for this move if you are long and holding any “at-risk” trades.
It is very likely, based on this research, that a downside price move to levels just above recent lows will take place over the next 5+ weeks. This will set up many great trading opportunities for skilled technical traders.
As a technical analyst and trader since 1997, I have been through a few bull/bear market cycles in stocks and commodities. I believe I have a good pulse on the market and timing key turning points for investing and short-term swing traders. 2020 is going to be an incredible year for skilled traders. Don’t miss all the incredible moves and trade setups.
I hope you found this informative, and if you would like to get a pre-market video every day before the opening bell, along with my trade alerts. These simple to follow ETF swing trades have our trading accounts sitting at new high water marks yet again this week, not many traders can say that this year. Visit my Active ETF Trading Newsletter.
If you have any type of retirement account and are looking for signals when to own equities, bonds, or cash, be sure to become a member of my Long-Term Investing Signals which we issued a new signal for subscribers.
Ride my coattails as I navigate these financial markets and build wealth while others lose nearly everything they own during the next financial crisis.
Chris Vermeulen
www.TheTechnicalTraders.com
Chris Vermeulen has been involved in the markets since 1997 and is the founder of Technical Traders Ltd. He is an internationally recognized technical analyst, trader, and is the author of the book: 7 Steps to Win With Logic
Through years of research, trading and helping individual traders around the world. He learned that many traders have great trading ideas, but they lack one thing, they struggle to execute trades in a systematic way for consistent results. Chris helps educate traders with a three-hour video course that can change your trading results for the better.
His mission is to help his clients boost their trading performance while reducing market exposure and portfolio volatility.
He is a regular speaker on HoweStreet.com, and the FinancialSurvivorNetwork radio shows. Chris was also featured on the cover of AmalgaTrader Magazine, and contributes articles to several leading financial hubs like MarketOracle.co.uk
Disclaimer: Nothing in this report should be construed as a solicitation to buy or sell any securities mentioned. Technical Traders Ltd., its owners and the author of this report are not registered broker-dealers or financial advisors. Before investing in any securities, you should consult with your financial advisor and a registered broker-dealer. Never make an investment based solely on what you read in an online or printed report, including this report, especially if the investment involves a small, thinly-traded company that isn’t well known. Technical Traders Ltd. and the author of this report has been paid by Cardiff Energy Corp. In addition, the author owns shares of Cardiff Energy Corp. and would also benefit from volume and price appreciation of its stock. The information provided here within should not be construed as a financial analysis but rather as an advertisement. The author’s views and opinions regarding the companies featured in reports are his own views and are based on information that he has researched independently and has received, which the author assumes to be reliable. Technical Traders Ltd. and the author of this report do not guarantee the accuracy, completeness, or usefulness of any content of this report, nor its fitness for any particular purpose. Lastly, the author does not guarantee that any of the companies mentioned in the reports will perform as expected, and any comparisons made to other companies may not be valid or come into effect.
Chris Vermeulen Archive |
© 2005-2022 http://www.MarketOracle.co.uk - The Market Oracle is a FREE Daily Financial Markets Analysis & Forecasting online publication.