


Fibonacci Price Modeling Suggests Massive Resistance Range In US Stock Markets
Stock-Markets / Stock Markets 2020 Jun 19, 2020 - 01:35 PM GMTBy: Chris_Vermeulen

The big selloff in the US markets last week (-1600 pts in the Dow Jones) on the comments from the US Fed aligns with previous Fibonacci Price Trigger levels throughout the early portion of 2020 to create a massive Support/Resistance range in the markets according to our research team. It is very likely that the big selloff bar from last week will also establish a minor Support/Resistance range within the price range of that big selloff bar.
One of the key technical components of our Fibonacci Price Modeling system is that it acts as a trend following system, projects key target and reversal levels, and also highlights key trigger levels as price rotates up and down in different time frames. The benefit we derive from this modeling system is that we can interpret the data into various forms of key technical factors for our friends, followers, and members.
Before you continue, be sure to opt-in to our free-market trend signals before closing this page, so you don’t miss our next special report!
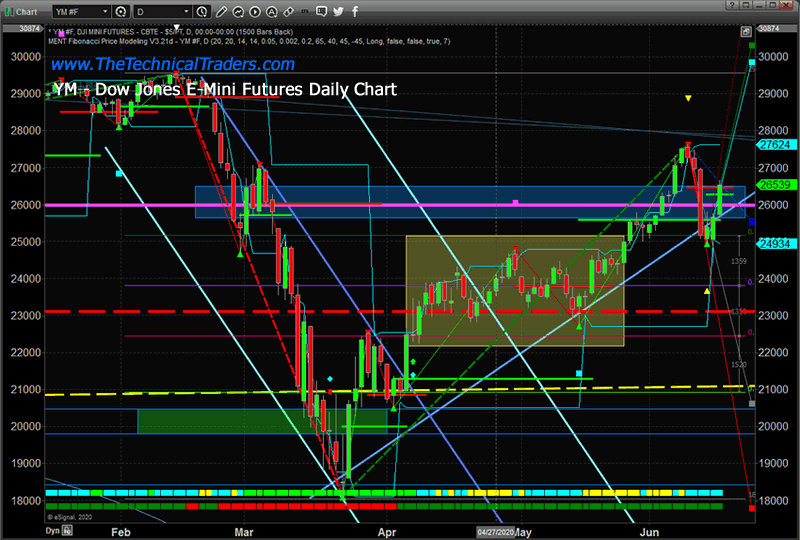
YM – DOW JONES DAILY CHART
Although this YM Daily chart, below, may be a bit complicated, pay attention to the BLUE SHADED RECTANGLE between 25,600 and 26,500. Additionally, pay attention to the heavy MAGENTA LINE near 26,000. This rectangle and the magenta line are derived from Fibonacci Trigger levels generated by our Fibonacci Price Modeling system.
You can see these Trigger Levels as GREEN and RED horizontal lines drawn just below new price peaks or just above new price bottoms. Fibonacci Price Theory is based on tracking price peaks and troughs in a process as price attempts to trend higher or lower. Our Fibonacci Price Modeling system attempts to adapt to price variances using a modified AI technology and attempts to highlight projected Trigger Levels and future potential Target Levels with each new price rotation.
Our researchers believe the BLUE RECTANGLE range will act as a major price support/resistance level after the big selloff bar last week. This price range, totaling almost 1000 points, is likely to prompt volatile price rotation near or within this range as price attempts to either breakout to the upside or breakdown into a new Bearish trend.
If the price moves lower, below the 25,500 level, there are very few prior Fibonacci Trigger levels that offer support on the way down. One, near 23,850, and additional deeper Trigger Levels near 20,000 to 20,850 are the only deeper reference points recently. Thus, our researchers believe any price breakdown below 25,500 could prompt a very deep and fast price correction in the markets – setting up a potential double-bottom type of pattern.
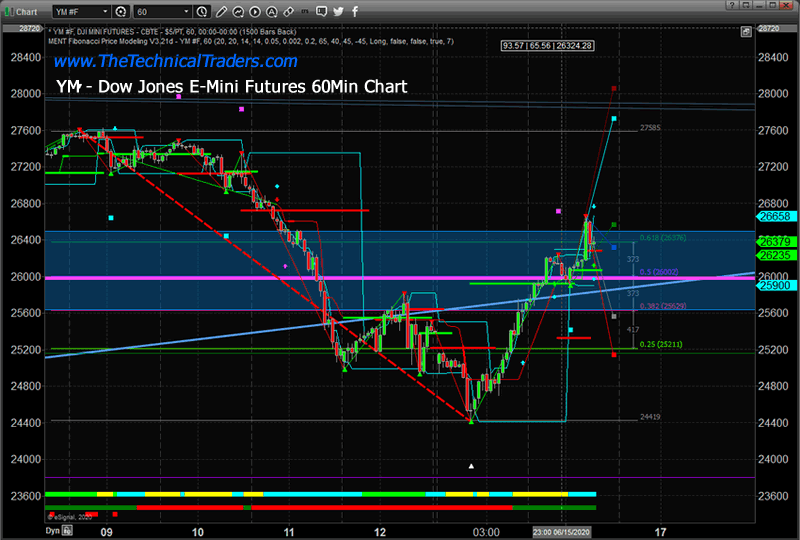
YM – DOW JONES 60 MINUTE CHART
This 60 Minute YM chart, generated about 70 minutes after the Daily chart, above, clearly shows how price reacted near the upper range of the BLUE Fibonacci Price Channel. Almost immediately after attempting to breach the upper range of the support channel, the price collapsed back into the channel and wiped out close to 300+ points very quickly.
Our research team believes the 26,000 will continue to act as a key price level going forward. The upward sloping price channel line, drawn as a LIGHT SKY-BLUE LINE through the recent downside price rotation, is another key price channel supporting the current market. Once both of these levels are breached to the downside, there is very little support to be found before reaching the 23,850 level.
As we’ve been warning our friends and clients, this is the time to stay very cautious with your trades as volatility will likely continue to be elevated and bit price rotations are likely as we head into Q2 earnings season. Everyone wants to see a strong recovery in the US markets and speculative traders are pushing in that direction. The reality of the situation may be that we see a longer-term recovery taking place over the next 6 to 12+ months.
Right now, the YM price is still above the heavy Magenta support level. We need to watch price activity as this level becomes critical for the price to attempt any future upside price moves. If the price falls below this level, then a deeper price breakdown may be initiating.
As a technical analyst and trader since 1997, I have been through a few bull/bear market cycles in stocks and commodities. I believe I have a good pulse on the market and timing key turning points for investing and short-term swing traders. 2020 is an incredible year for traders and investors. Don’t miss all the incredible trends and trade setups.
Subscribers of my Active ETF Swing Trading Newsletter had our trading accounts close at a new high watermark. We not only exited the equities market as it started to roll over in February, but we profited from the sell-off in a very controlled way with TLT bonds for a 20% gain. This week we closed out SPY ETF trade taking advantage of this bounce and entered a new trade with our account is at another all-time high value.
Ride my coattails as I navigate these financial markets and build wealth while others watch most of their retirement funds drop another 35-65% during the rest of this financial crisis going into late 2020 and early 2021.
Just think of this for a minute. While most of us have active trading accounts, what is even more important are our long-term investment and retirement accounts. Why? Because they are, in most cases, our largest store of wealth other than our homes, and if they are not protected during the next bear market, you could lose 25-50% or more of your net worth. The good news is we can preserve and even grow our long term capital when things get ugly like they are now and ill show you how. One of the best trades is one your financial advisor will never let you do because they do not make money from the trade/position but we do have a way for you or your advisor can take advantage of the market gyrations with our Technical Wealth Advisor investing signals.
If you have any type of retirement account and are looking for signals when to own equities, bonds, or cash, be sure to become a member of my Passive Long-Term ETF Investing Signals which we issued a new signal for subscribers.
Chris Vermeulen
www.TheTechnicalTraders.com
Chris Vermeulen has been involved in the markets since 1997 and is the founder of Technical Traders Ltd. He is an internationally recognized technical analyst, trader, and is the author of the book: 7 Steps to Win With Logic
Through years of research, trading and helping individual traders around the world. He learned that many traders have great trading ideas, but they lack one thing, they struggle to execute trades in a systematic way for consistent results. Chris helps educate traders with a three-hour video course that can change your trading results for the better.
His mission is to help his clients boost their trading performance while reducing market exposure and portfolio volatility.
He is a regular speaker on HoweStreet.com, and the FinancialSurvivorNetwork radio shows. Chris was also featured on the cover of AmalgaTrader Magazine, and contributes articles to several leading financial hubs like MarketOracle.co.uk
Disclaimer: Nothing in this report should be construed as a solicitation to buy or sell any securities mentioned. Technical Traders Ltd., its owners and the author of this report are not registered broker-dealers or financial advisors. Before investing in any securities, you should consult with your financial advisor and a registered broker-dealer. Never make an investment based solely on what you read in an online or printed report, including this report, especially if the investment involves a small, thinly-traded company that isn’t well known. Technical Traders Ltd. and the author of this report has been paid by Cardiff Energy Corp. In addition, the author owns shares of Cardiff Energy Corp. and would also benefit from volume and price appreciation of its stock. The information provided here within should not be construed as a financial analysis but rather as an advertisement. The author’s views and opinions regarding the companies featured in reports are his own views and are based on information that he has researched independently and has received, which the author assumes to be reliable. Technical Traders Ltd. and the author of this report do not guarantee the accuracy, completeness, or usefulness of any content of this report, nor its fitness for any particular purpose. Lastly, the author does not guarantee that any of the companies mentioned in the reports will perform as expected, and any comparisons made to other companies may not be valid or come into effect.
Chris Vermeulen Archive |
© 2005-2022 http://www.MarketOracle.co.uk - The Market Oracle is a FREE Daily Financial Markets Analysis & Forecasting online publication.