


Stock Market Minor Correction Underway
Stock-Markets / Stock Markets 2020 Jul 28, 2020 - 01:20 PM GMTBy: Andre_Gratian

Current Position of the Market
SPX Long-term trend: For now, the best guesstimate is that we are still in the bull market which started in 2009.
SPX Intermediate trend: We should be approaching an important high, with confirmation coming over the near term.
Analysis of the short-term trend is done daily with the help of hourly charts. It is an important adjunct to the analysis of daily and weekly charts which discuss longer market trends.
Daily market analysis of the short-term trend is reserved for subscribers. If you would like to sign up for a FREE 4-week trial period of daily comments, please let me know at anvi1962@cableone.net
Minor Correction Underway
Long Term: With the degree of recovery that SPX has made from the March low, it is likely that 2192 was only wave 4 of the bull market which started in 2009.
Important cycles
The 40-wk cycle (~7/20) has apparently inverted – 26-day 7/28 - 45-td cycle ~8/14
Market Analysis (Charts courtesy of QCharts)
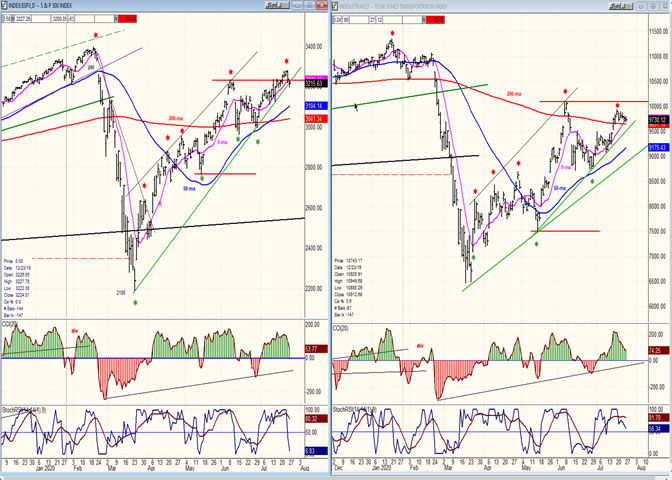
SPX- TRAN daily charts:
The purpose of showing these two charts side by side is to get an early warning of top and bottom trend-reversals. The TRAN appears to have the ability of making us aware of a reversal in the SPX before it happens, predominantly at a top. While weekly charts are useful for intermediate reversals, the shorter-trend ones are much clearer on daily charts.
Comparable tops and bottoms are identified by red and green asterisks. The warnings came several days ahead at the primary top and bottom, but they were also clear at the recent minor top. The weekly pattern started to diverge in October 2018 and has continued since. Is it possible that this means that we are now coming to the end of the bull market?
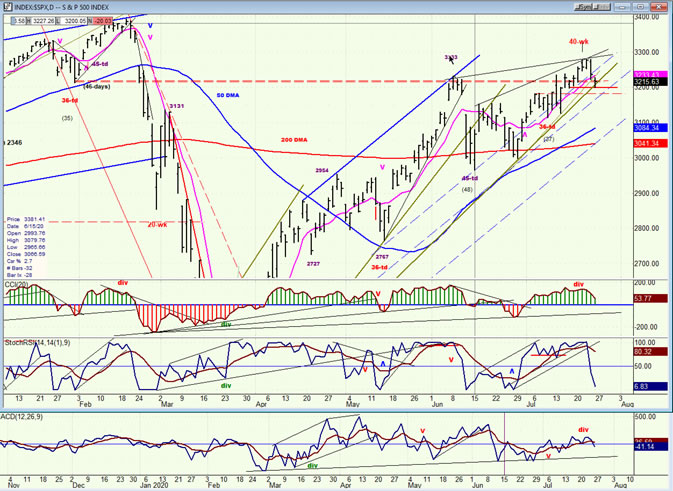
SPX daily chart
The market’s action since the March low has been a puzzle to me. I did not understand how it could be so bullish in the presence of the immense economic damage wrought by Covid-19 but as an analysist, I had to accept what SPX was doing. The 40-wk cycle has been another puzzle which has now been solved by the realization that it inverted. Can we assume that an inversion of this cycle will have the same effect, but in reverse, as an important low would have? We are about to find out! Between now and the end of August, several cycles which normally bring about a short-term low in the market will be bottoming. I wonder if the 40-wk inversion will add its weight to this cycle cluster and bring about a sizeable correction that few expect at this time?
The current short-term cycle (26-d) should bottom early next week. If SPX fails to make a new high afterwards, it will be a sign that an important correction could come next. The daily indicators appear to be priming for this. They are currently rolling over from an overbought condition. If they do not exhibit real strength in next week’s market recovery, it will be a greater warning for caution. The last 200-point recovery from the 3000 level did not show the type of momentum exhibited by the last two up-phases from the March low. It looks like a fifth wave from that low, which would complete the entire move. It will be interesting to see how much of a count is produced by the P&F chart after the trend has come to an end.
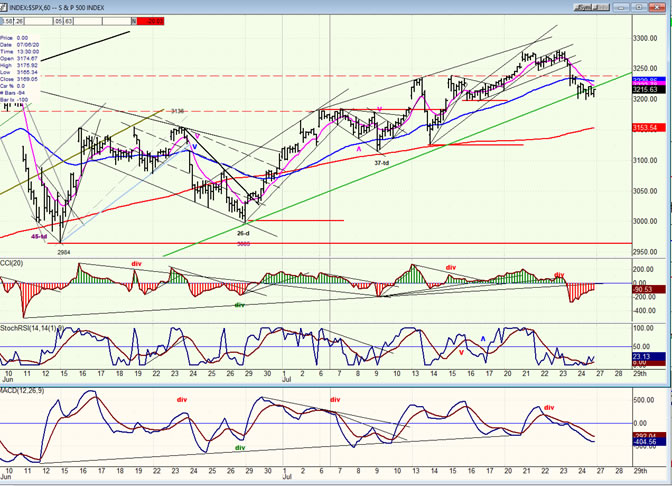
SPX hourly chart
The chart below shows the entire “fifth”(?) wave from 2984. It also shows the green trend line from the March low which is in the process of being breached. With a cycle low due Monday or Tuesday, we should see a little more weakness (perhaps down to about 3180) followed by a rally to a new high.
The CCI is already showing some positive divergence, but another low which reverses quickly would not lose that divergence and it should prepare the index for a new short-term uptrend. It could coincide with the announcement of a new relief package that is being prepared by congress and which may bring about a new high in the market. We’ll try to assess the potential for that move after SPX has reversed and we have a clearer idea of what the final count will be.
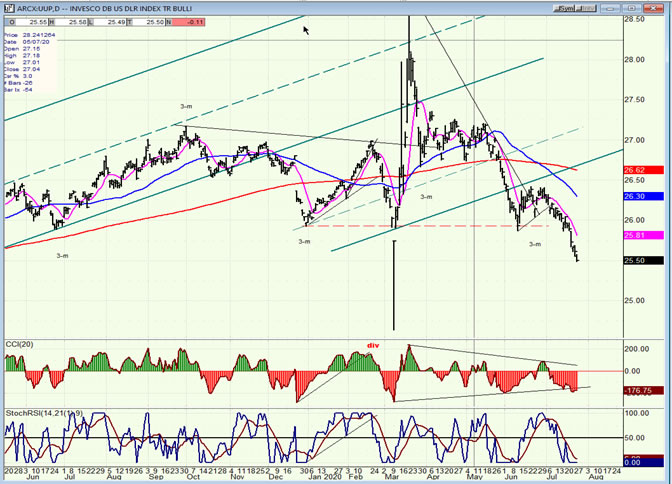
- UUP (dollar ETF)
- UUP has continued its downtrend, which is not over if USD (94.37) continues to decline into its P&F price objective of 93.
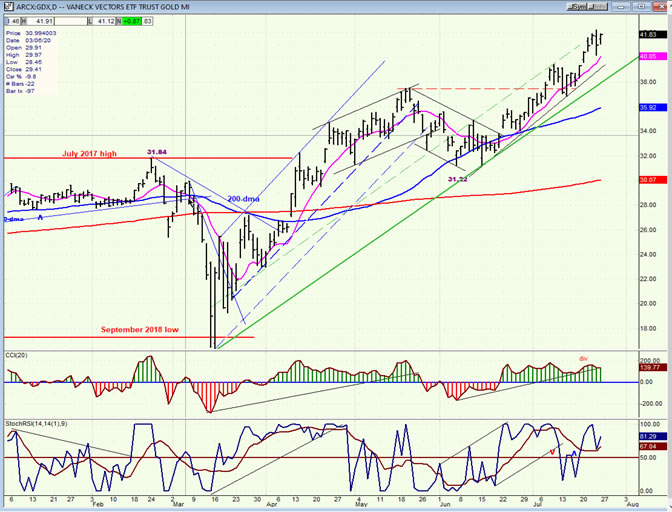
- GDX (gold miners)
- GDX has pushed its move beyond its expected price target of 40, but the index is still vulnerable to a short-term correction before resuming its long-term trend.
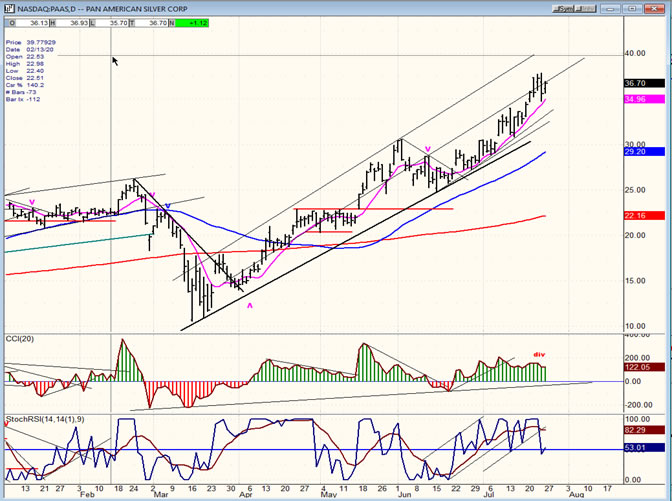
- PAAS (Pan American Silver Corp)
- PAAS closely follows (leads?) GDX with the same analysis applying.
-
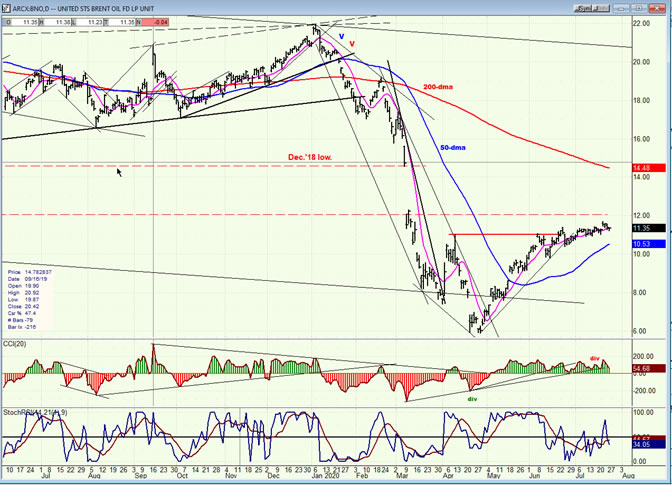
- BNO (U.S. Brent Oil fund)
- Despite its apparent need for a correction, BNO has continued its upward crawl which could reach 12 before it starts to pull back.
-
- Summary
- Last week anticipated a minor correction which could extend into early next week. Afterwards, the finishing touch could be put on by the advance from 2984, followed by a larger correction.
Andre
FREE TRIAL SUBSCRIPTON
For a FREE 4-week trial, send an email to anvi1962@cableone.net, or go to www.marketurningpoints.com and click on "subscribe". There, you will also find subscription options, payment plans, weekly newsletters, and general information. By clicking on "Free Newsletter" you can get a preview of the latest newsletter which is normally posted on Sunday afternoon (unless it happens to be a 3-day weekend, in which case it could be posted on Monday).
Disclaimer - The above comments about the financial markets are based purely on what I consider to be sound technical analysis principles uncompromised by fundamental considerations. They represent my own opinion and are not meant to be construed as trading or investment advice, but are offered as an analytical point of view which might be of interest to those who follow stock market cycles and technical analysis.
Andre Gratian Archive |
© 2005-2022 http://www.MarketOracle.co.uk - The Market Oracle is a FREE Daily Financial Markets Analysis & Forecasting online publication.