


Stock Market Correction Approaching Initial Objective
Stock-Markets / Stock Markets 2020 Sep 22, 2020 - 05:51 PM GMTBy: Andre_Gratian

Current Position of the Market
SPX Long-term trend: For now, the best guesstimate is that we are still in the bull market which started in 2009. Where we go from here and how far will be gauged after the September-October correction.
SPX Intermediate trend: Potential intermediate correction in progress.
Analysis of the short-term trend is done daily with the help of hourly charts. It is an important adjunct to the analysis of daily and weekly charts which discuss longer market trends.
Daily market analysis of the short-term trend is reserved for subscribers. If you would like to sign up for a FREE 4-week trial period of daily comments, please let me know at anvi1962@cableone.net
Approaching Initial Objective
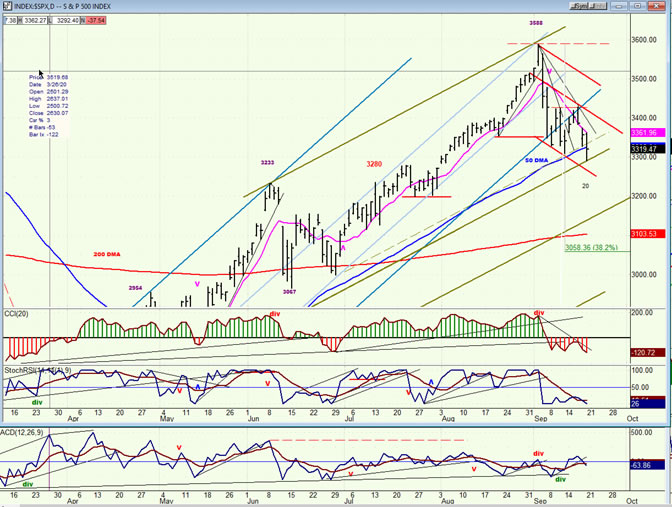
P&F: Short-term projection: 3300-3260 - Objective reached on 9/18 with SPX 3292 intra-day low.
Cycles: Looking ahead! 90-yr cycle – last low: 1932. Next low: 2022
7-yr cycle – last low: 2016. Next low: 2023
20-td – 9/17 - bottomed on 9/18
Nest of short-term cycle lows on about 10/15-20
Market Analysis (Charts courtesy of QCharts
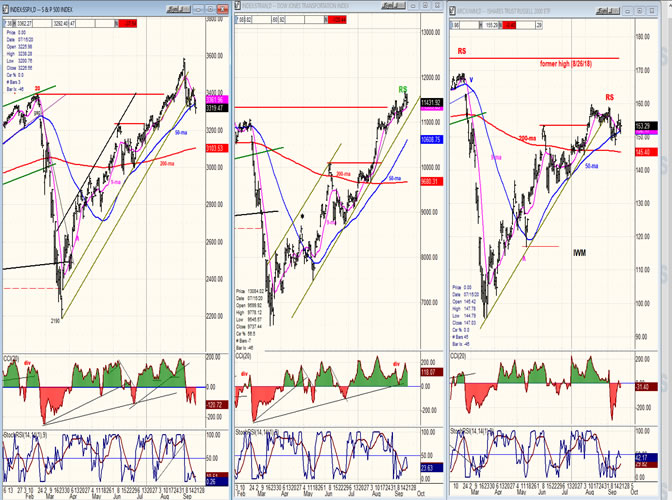
SPX-TRAN-IWM daily charts:
Both TRAN and IWM showed relative strength to SPX last week, suggesting that we should start to rally. This would make sense since a short-term cycle apparently bottomed right on time, on Friday. The relative strength of TRAN to SPX is far more positive than IWM’s. I am not sure if this has implications for the longer term. I have not followed this aspect of their relative strength long enough to come to a firm conclusion. I assume the days ahead will make this clearer.
SPX daily chart
Since the decline from the 2588 high, the daily trend has shifted from the blue channel to the green channel. The green channel is divided into sections which are anchored at various previous lows. The first parallel which coincided with the 50-dma did not hold and was breached by the bottoming of the 20-td cycle which made its low on Friday at the suggested short-term P&F target, and this allowed for the next parallel close below to hold and provide a rally which could climb back above the 50-dma and repair some of the damage -- temporarily. With the nest of cycles due in mid-October, it is likely that after the upward phase of the 20-td has exhausted itself, the decline will continue.
It is too soon to establish another P&F projection but we can get a sense of where the next low might occur by considering a potential .382 retracement of the uptrend from March. This is reinforced by the fact that this retracement is just below the 200-dma which tends to provide support.
Last week’s decline has sent the momentum oscillators (CCI,SRSI) back to their lows, and the A-D oscillator from a slight positive back into negative. However, the latter has developed some good positive divergence which strengthens the potential for a countertrend rally in conjuntion with the minor cycle reversal.
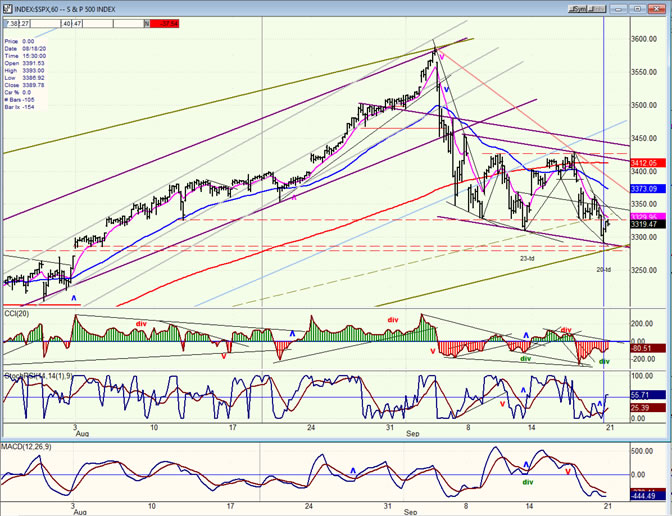
SPX hourly chart
There were two short-term cycle lows a week apart which conspired to reverse the primary trend from the March low and created a sharp profit-taking spree. After the first one had made its low, it caused a sharp rebound, but the second cycle also had to have its say. At first, it looked as if it would bottom at a slightly higher level but, although it tried to hold at 3330, it could not and dropped to just below 3300 on Friday. The 35-point bounce from the low which stopped at its 9-hr MA just before the close was preceded by some good positive divergence at the hourly level – a common occurrence.
It would not take much to push the index back into a short-term uptrend. A positive opening on Monday morning with any kind of follow-through would most likely produce a short-term buy signal in the momentum oscillators. The SRSI stopped just short of a giving one, but it will require both becoming positive to give a confirmation.
A short-term rally back to the top of the channel would take the index close to the 3450 level, and that may be all that we can expect for now. In about a week, we could be making a secondary top which would result in an extension of the decline into mid-October.
-
- UUP (dollar ETF) ($USD chart not available from this data provider)
- UUP has been holding above its recent low, perhaps building a base to move higher. However, the 50-MA looks just ahead, and it will have to be exceeded before further appreciation can take place.
-
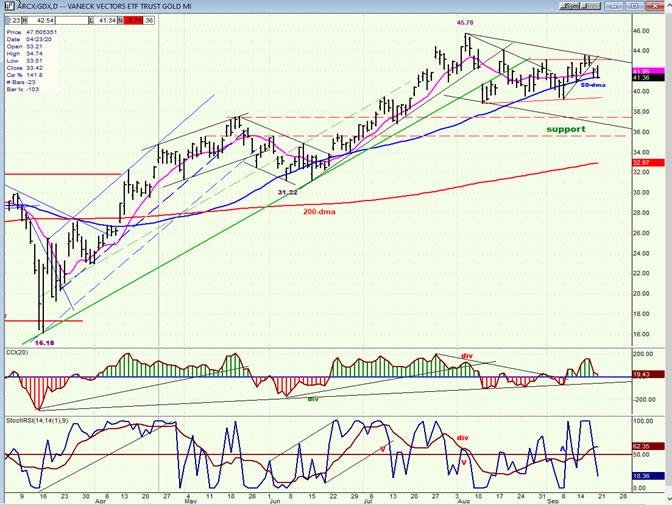
- GDX (gold miners)
- GDX pushed slightly higher and pulled back. It has continued to find support on the 50-MA but each time, it could only muster a weak bounce instead of finding aggressive buyers. Although the indicators have not yet given a sell signal, if this action continues it will result in additional consolidation -- perhaps back down to about the 38.00 level where there is good support.
-
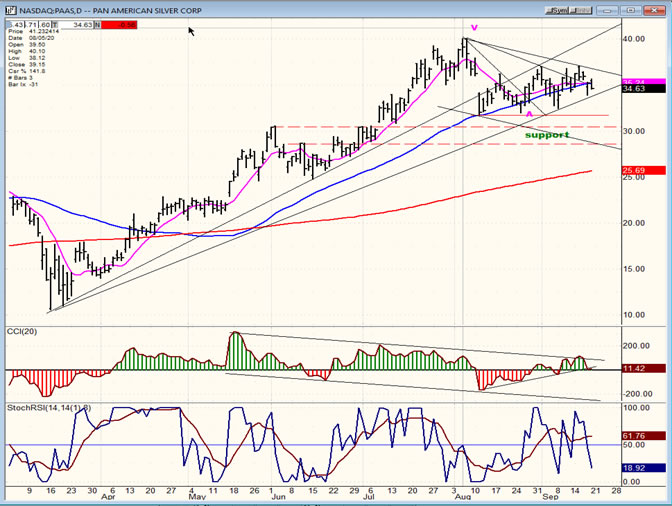
- PAAS (Pan American Silver Corp)
- PAAS is in the same fix as GDX and it could pull back to about 30.00 before finding good support.
-
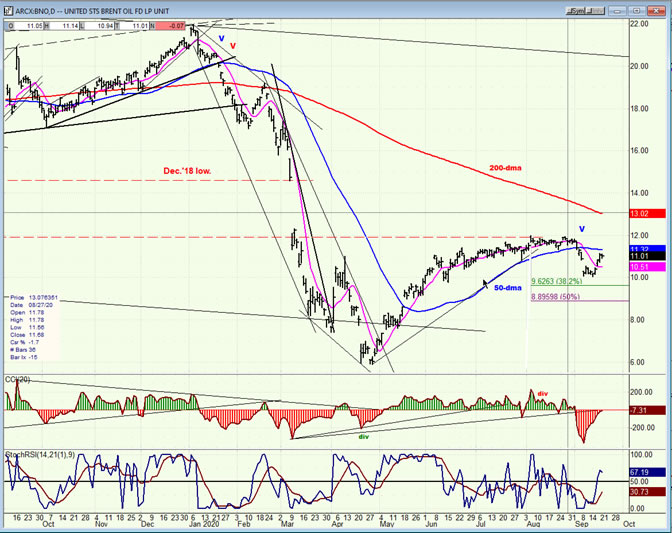
- BNO (U.S. Brent Oil fund)
- BNO bounced but must get back above the 50-MA to resume its uptrend to the 200-MA (13.02).
-
- Summary
SPX has reacted to two minor cycles making their lows a week apart and has most likely ended its initial correction phase. After a rebound which could take it back to the top of the current consolidation channel near the 3450 level, it should be ready for another, possibly more severe phase of the correction.
Andre
FREE TRIAL SUBSCRIPTON
For a FREE 4-week trial, send an email to anvi1962@cableone.net, or go to www.marketurningpoints.com and click on "subscribe". There, you will also find subscription options, payment plans, weekly newsletters, and general information. By clicking on "Free Newsletter" you can get a preview of the latest newsletter which is normally posted on Sunday afternoon (unless it happens to be a 3-day weekend, in which case it could be posted on Monday).
Disclaimer - The above comments about the financial markets are based purely on what I consider to be sound technical analysis principles uncompromised by fundamental considerations. They represent my own opinion and are not meant to be construed as trading or investment advice, but are offered as an analytical point of view which might be of interest to those who follow stock market cycles and technical analysis.
Andre Gratian Archive |
© 2005-2022 http://www.MarketOracle.co.uk - The Market Oracle is a FREE Daily Financial Markets Analysis & Forecasting online publication.