


Global Stock Markets Break Hard To The Downside – Watch Support Levels
Stock-Markets / Stock Markets 2020 Sep 23, 2020 - 06:53 PM GMTBy: Chris_Vermeulen

RESEARCH HIGHLIGHTS:
- New reports of widespread financial corruption likely triggered the current sell-off.
- Watch out for market support levels to see if this is a short-term correction or the start of a downtrend.
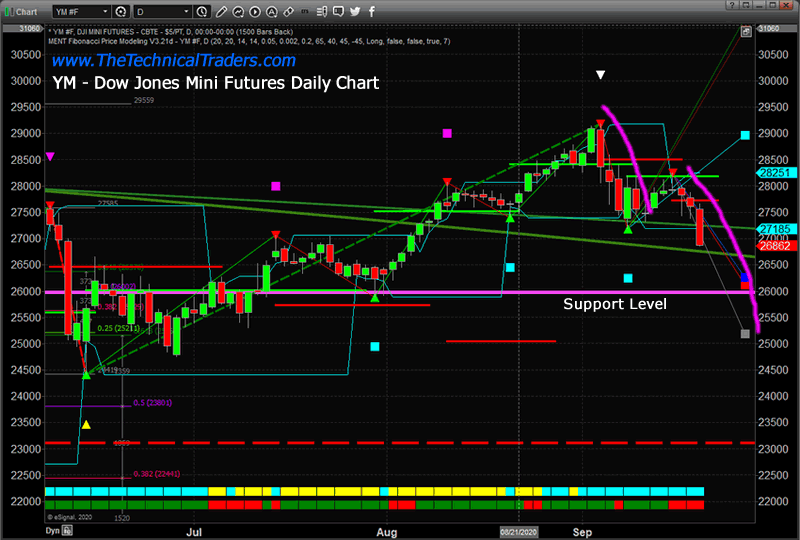
- Support for the DOW is just above 26,000.
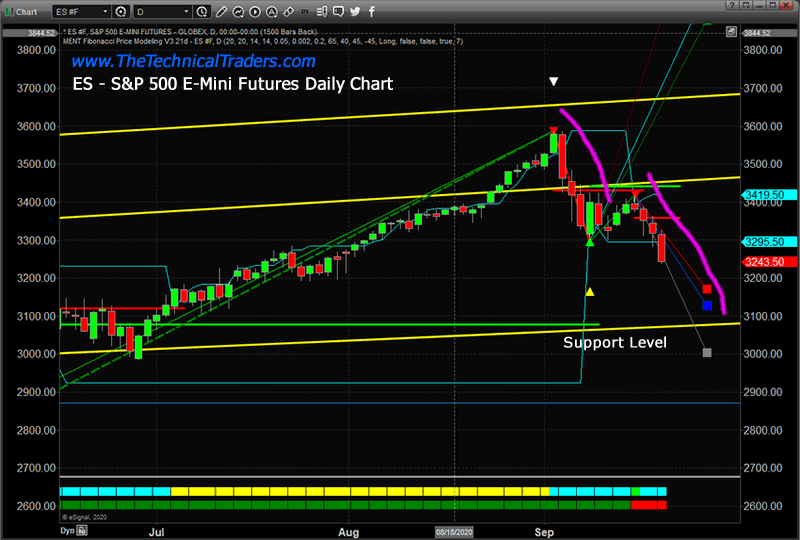
- Support for the SP500 is around 3,100.
US and global markets were already under pressure over the past few weeks related to COVID-19 issues and global economic expectations. The technology sector had driven valuations to levels not seen since the DOT COM bubble near the end of August and many of the US Indexes has reached or breached all-time highs again. My research team and I warned followers to “stay cautious” throughout much of the price rally as our proprietary price modeling systems suggests the rally was isolated and not organic. The US Fed has spewed capital into the markets and speculative traders piled into the “excess phase” of the market to drive price levels higher. Take a moment to review these recent research posts to learn more:
September 13, 2020: MAKE OR BREAK – BIG TRENDS AHEAD
September 1, 2020: ARE FANGS GOING TO BREAKDOWN SOON?
August 27, 2020: EXPANDING WEDGE MAY PROMPT BIG PRICE CORRECTION – COULD A BIG TOP BE SETTING UP RIGHT NOW?
MARKETS SELLING OFF ON NEWS
Before we get into the price charts, we want to highlight the news that is driving much of this selloff in the markets. Early Monday reports (or late Sunday, depending on your location) were published highlighting illegal and nefarious activity by many global banks related to money laundering and supporting criminal rogue elements throughout the globe. The names of the banks implicated include Deutsche Bank, Standard Chartered, Barklays, Commerzbank, Danske Bank and HSBC Holdings. It appears the European and Asian banks had the largest exposure to this activity and risk. There is some talk that Russian banks may have been involved as well (unconfirmed at this time by our research).
What this means for traders is that a broad, global financial crisis may be starting to unfold – this time vastly different than the 2008-09 credit crisis. This event will be centered around illegal and corrupt actions at some of the world’s largest financial institutions and the far-reaching aspects of rogue government or private elements involved in this activity. We believe the markets will attempt to find support after the shock of this news is digested. Longer-term, I believe a broader market downtrend may continue – it’s just a matter of what happens next and how fast global authorities are able to engage in a proper form of legal resolution (indictments).
At this point in time, the news that global banks were acting illegally and improperly may prompt a much broader market downtrend over time. Right now, we believe the initial “shock-wave” will be processed in price and support levels will be found fairly quickly.
SUPPORT LEVELS
This Daily YM chart below highlights the support level near 26,000 that we believe will become the first floor for price as this selloff continues. Our proprietary Fibonacci price modeling system is also suggesting support levels just above the 26,000 are valid (see the RED and BLUE SQUARES on the right side of this chart). My research team believe price will attempt to find support near the 26,000 level as this broad market selloff matures.
This ES Daily chart also highlights the support levels near 3,090 (the lower YELLOW line) and aligns with our proprietary Fibonacci price modeling suggested support levels just above 3,100. We believe this will be the first level of support for the ES if the downtrend continues.
Yes, my team has been warning to stay cautious throughout much of the uptrend and we have highlighted a multi-year Head-and-Shoulders pattern that we believed could prompt a broader market decline. But we were not aware of this illegal activity related to the global banking system. Our research helps to confirm that technical analysis and our proprietary price modeling/research systems can act as clear forward-looking techniques for any skilled traders. The theory that price always internalizes news before or as the news happens suggests that technical analysis will, in almost all cases, highlight the most probable outcome before the news is known. Only in very rare “acts of God” is technical analysis sometimes delayed in reacting to the news.
As a technical analyst and trader since 1997, I have been through a few bull/bear market cycles in stocks and commodities. I believe I have a good pulse on the market and timing key turning points for investing and short-term swing traders.
If you want to survive the trading over a long period of time, then you learn fairly quickly how important it is to protect against risk and to properly size your trades. Subscribers of my Active ETF Swing Trading Newsletter can ride my coattails as I navigate these financial markets and build wealth. My research and trading team are here to help you find better trades and navigate these incredibly crazy market trends.
While most of us have active trading accounts, our long-term investment and retirement accounts are equally at risk. We can also help you preserve and even grow your long term capital when things get ugly (likely now) with our Passive Long-Term ETF Investing Signals. Don’t wait until it is too late – subscribe today!
Chris Vermeulen
www.TheTechnicalTraders.com
Chris Vermeulen has been involved in the markets since 1997 and is the founder of Technical Traders Ltd. He is an internationally recognized technical analyst, trader, and is the author of the book: 7 Steps to Win With Logic
Through years of research, trading and helping individual traders around the world. He learned that many traders have great trading ideas, but they lack one thing, they struggle to execute trades in a systematic way for consistent results. Chris helps educate traders with a three-hour video course that can change your trading results for the better.
His mission is to help his clients boost their trading performance while reducing market exposure and portfolio volatility.
He is a regular speaker on HoweStreet.com, and the FinancialSurvivorNetwork radio shows. Chris was also featured on the cover of AmalgaTrader Magazine, and contributes articles to several leading financial hubs like MarketOracle.co.uk
Disclaimer: Nothing in this report should be construed as a solicitation to buy or sell any securities mentioned. Technical Traders Ltd., its owners and the author of this report are not registered broker-dealers or financial advisors. Before investing in any securities, you should consult with your financial advisor and a registered broker-dealer. Never make an investment based solely on what you read in an online or printed report, including this report, especially if the investment involves a small, thinly-traded company that isn’t well known. Technical Traders Ltd. and the author of this report has been paid by Cardiff Energy Corp. In addition, the author owns shares of Cardiff Energy Corp. and would also benefit from volume and price appreciation of its stock. The information provided here within should not be construed as a financial analysis but rather as an advertisement. The author’s views and opinions regarding the companies featured in reports are his own views and are based on information that he has researched independently and has received, which the author assumes to be reliable. Technical Traders Ltd. and the author of this report do not guarantee the accuracy, completeness, or usefulness of any content of this report, nor its fitness for any particular purpose. Lastly, the author does not guarantee that any of the companies mentioned in the reports will perform as expected, and any comparisons made to other companies may not be valid or come into effect.
Chris Vermeulen Archive |
© 2005-2022 http://www.MarketOracle.co.uk - The Market Oracle is a FREE Daily Financial Markets Analysis & Forecasting online publication.