


Stock Market Pullback that’s largely driven by Tech and Growth Stocks
Stock-Markets / Stock Market 2021 Mar 11, 2021 - 03:48 PM GMTBy: Troy_Bombardia

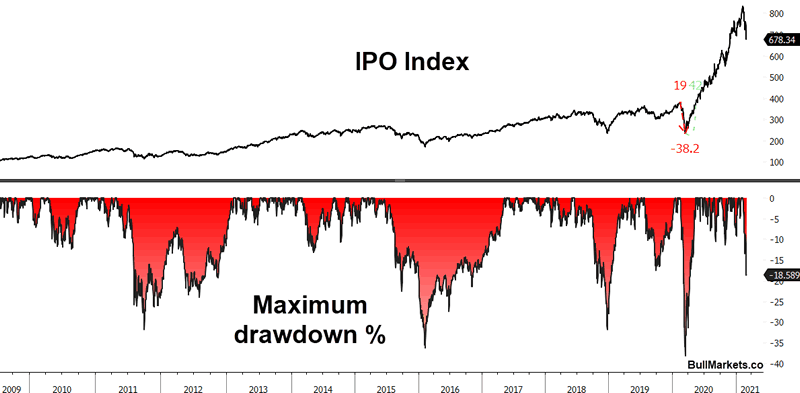
Last week saw a wide divergence in the stock market. Sectors that exploded higher after March 2020 (e.g. tech, IPOs, growth stocks) saw sharp drawdowns while sectors that lagged significantly (e.g. energy & finance) are catching up. In this Market Report I will highlight a few indicators that matter right now. But more importantly, I’ll discuss how we’re investing & trading in this environment because at the end of the day, the only thing that matters is how you’re positioned. Everything else is just noise.
Sentiment
Sentiment is not displaying excessive pessimism despite the recent selloff. Here’s the NASDAQ Daily Sentiment Index:
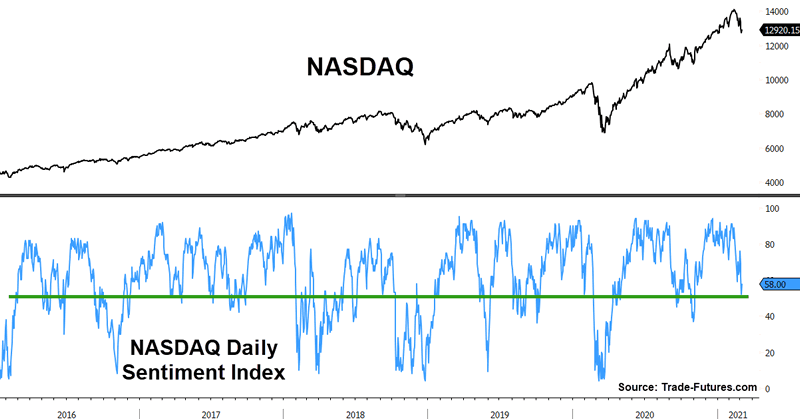
Now of course, sentiment doesn’t need to fall to extremely low readings for markets to bottom. Sentiment is mostly just a function of price. Markets bottomed last October on sentiment that wasn’t much lower than today.
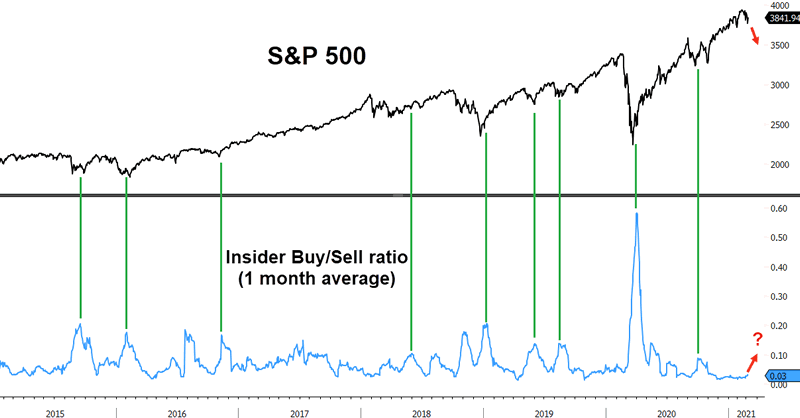
Insider Buy/Sell
There’s been a slight uptick in corporate insider buying recently as stocks pullback. Past market bottoms saw a higher insider buy/sell ratio, so this could be a sign that the pullback/correction isn’t yet over.
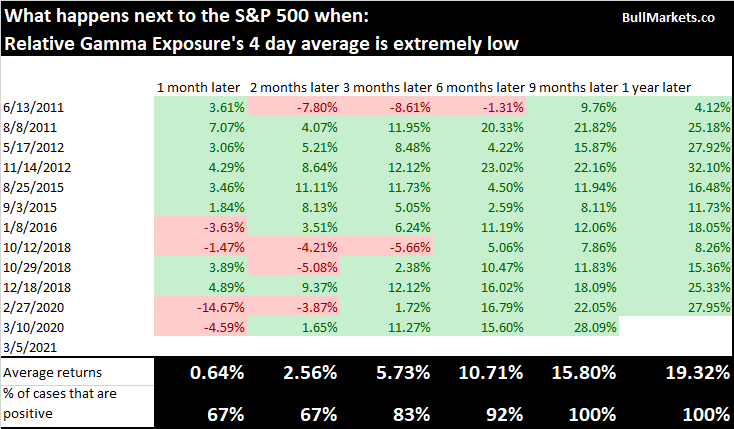
Relative Gamma Exposure
Relative Gamma Exposure (Gamma Exposure divided by the S&P 500’s value) plunged to a record low.
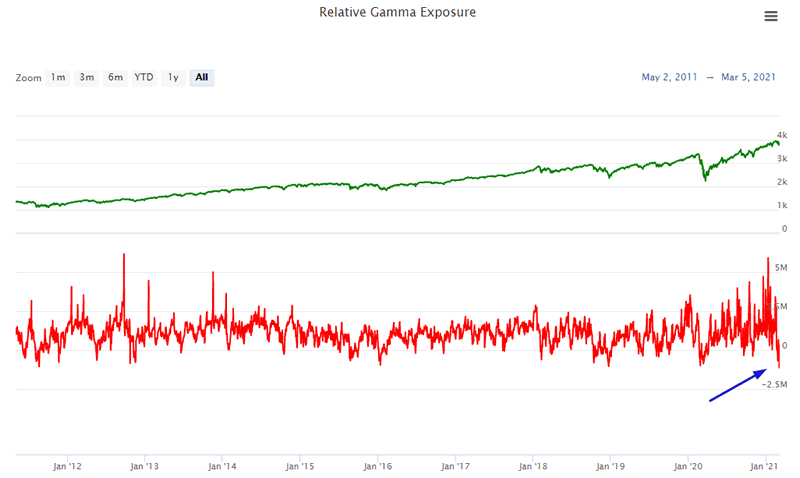
Historically, such low Relative Gamma Exposure was a bullish sign for stocks over the next 3 months:
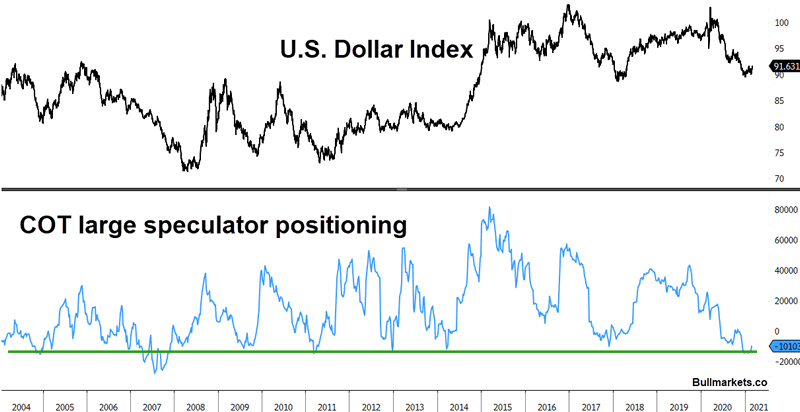
USD rally
Stocks and the dollar have been inversely correlated over the past year, so it’s no surprise that the U.S. Dollar is rallying right now as stocks pullback. There’s been a slight uptick in large speculator positioning towards the Dollar. The dollar will rally higher if stocks fall further. This matters for funds like ours that invest in UK private assets.
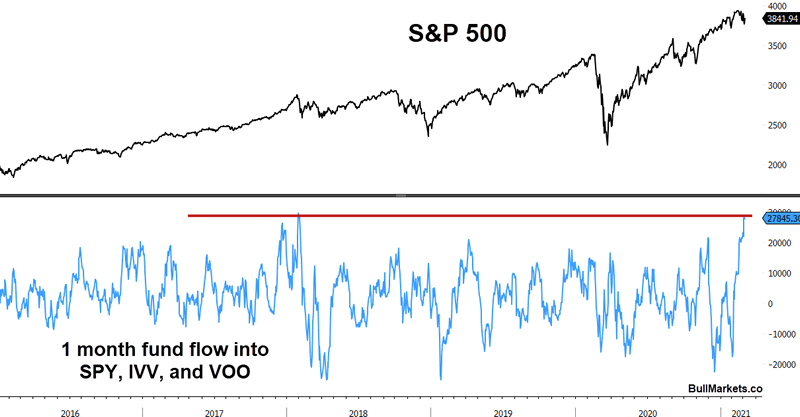
Fund flows
The recent pullback in stocks has been accompanied by strong fund flows into S&P 500 ETFs. The last time this happened was in January 2018, when stocks fell further and VIX spiked.
Breadth divergence
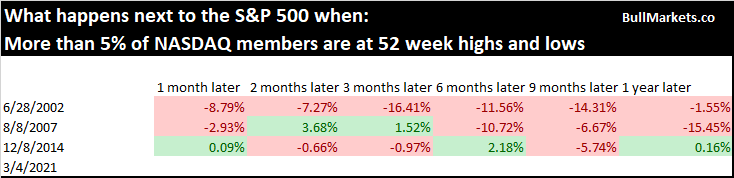
Since the recent selloff is very sector specific, a large % of stocks are at 52 week highs AND 52 week lows:
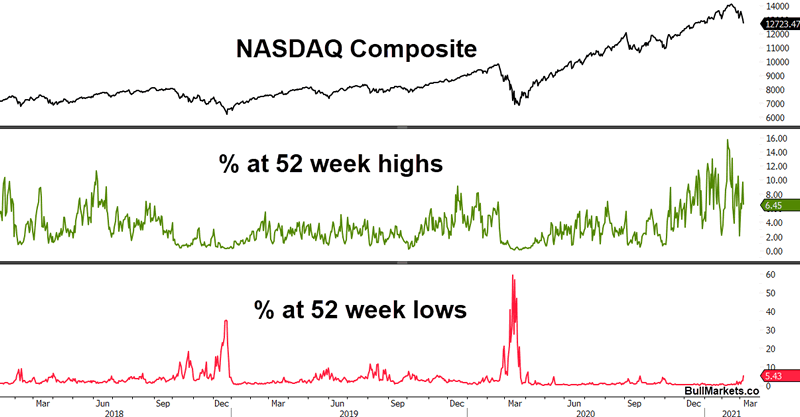
This kind of split market breadth historically was not a good sign for stocks:
I pointed out important long term risks for the stock market. These risks do not matter over the next few months to 1 year, but will matter on a 2-5 year time frame.
Conclusion: how we’re investing and trading
The above indicators and charts point a confusing picture for markets. Some suggest that the bottom is here, whereas others suggest that there’s more room for stocks to fall. Here’s how we’re positioning our portfolio:
Long term portfolio
I don’t have a crystal ball. Stocks will either explode higher over the next 12 years or we’ll experience a major 15%+ correction. The buy-the-dip mentality is still very much alive and bubbles typically require more than 1 shakeout to end. This sounds like stating the obvious, but think about it for a moment. We have:
- Rampant speculation and near-record valuations.
- Insanely strong momentum where people now think that 10%-a-month gains are the norm!
The last time this confluence of excess risk-taking and powerful momentum happened was during the dot-com bubble. Only with 20/20 hindsight do we know that the bubble ended in 2000. In reality, the dot-com bubble could have ended in 1997, 1998, 1999, or 2000. Bubbles can end today, or can last longer than you expect.
While we won’t pretend to know what stocks will do over the next year, we do know 1 thing: long term risk is high. We do not invest in “lose-50%-or-win-100%” scenarios. As a result, our long term portfolio is not invested in public equities. Instead, this part of our portfolio is focused on attractive opportunities in private markets where we can earn double-digit returns with excellent downside protection.
In a normal scenario, the NASDAQ’s current pullback would be enough for us to start scaling in. Many growth and tech stocks are down significantly. HOWEVER, this is not a normal environment. Long term risk remains exceptionally high. This is either the start of a much larger decline or the end of a normal pullback/correction. Again, stating the obvious. But we do not participate in “lose-50%-or-win-100%” bets. I’ve seen growth stock investors down 20-30% while the S&P is down mid-single digits right now. If the S&P falls -15%, these growth investors will lose more than 50%.
Short term portfolio
Our short term portfolio focuses strictly on equities. The trend is neutral, so we are hedged. The specific trades we take are determined by our trading algorithms. But due to high long term risk in the stock market, we have decreased the allocation to our short term portfolio (equities) and increased the allocation to our long term portfolio (private markets).
By Troy Bombardia
Copyright 2021 © Troy Bombardia - All Rights Reserved
Disclaimer: The above is a matter of opinion provided for general information purposes only and is not intended as investment advice. Information and analysis above are derived from sources and utilising methods believed to be reliable, but we cannot accept responsibility for any losses you may incur as a result of this analysis. Individuals should consult with their personal financial advisors.
© 2005-2022 http://www.MarketOracle.co.uk - The Market Oracle is a FREE Daily Financial Markets Analysis & Forecasting online publication.