


Stocks Bear Market Building a Base for Relief Rally
Stock-Markets / Stocks Bear Market Nov 02, 2008 - 07:33 PM GMTBy: Andre_Gratian

 Current Position of the Market
SPX: Long-term trend -
Down! The very-long-term cycles have taken over earlier than anticipated and if they make their lows when expected, the bear market which started in October 2007 should continue until 2012-2014.
SPX: Intermediate trend - Potential lows were made in October. A pull-back into November is probable, and new lows are still possible.
Analysis of the short-term trend is done on a daily basis with the help of hourly charts. It is an important adjunct to the analysis of daily and weekly charts which discusses the course of longer market trends.
Daily market analysis of the short term trend is reserved for subscribers. If you would like to sign up for a FREE 4-week trial period of daily comments, please let me know at ajg@cybertrails.com .
Overview:
During the last month, the stock market has showed an exceptional amount of volatility and broken all sorts of daily trading records. It has probed the area just above the 2002 and 2003 lows a number of times, each time finding strong support and rebounding sharply. It appears to be building a base from which to launch a recovery rally, or...it is only a consolidation in a downtrend! Which is it?
One thing for sure, this is not the end of the bear market. If we believe what the very-longterm cycles are telling us, this will not come for a few more years. Nor can we be certain that we have made an intermediate low from which we can begin an extended rally of several weeks. In "Current position of the market" above, I stated earlier that there could be an extension of the decline into November. This is still possible since several cycles are due to make their lows in the middle of the month, including the 9-mo cycle.
Two factors which lie directly ahead will have an influence on the market. The first is the investor reaction to the voter's choice for a new President, next Tuesday. The other is the employment report the following Friday! Recent statistics are suggesting that the economy is deteriorating rapidly, and the jobs report could be another confirmation.
As we will see below, the chart pattern has yet to confirm that the SPX has made a substantial turn for the better, and important indices, such as the NASDAQ, NYSE and others, made new lows this past Tuesday. There is nothing to indicate with certainty that a bottom is yet in place, therefore be aware of the possibility of another low during the month of November.
What's ahead?
Chart pattern and momentum:
Let's start with the weekly chart of the SPX. In one year, the index has retraced practically all its gains of the last five! The decline of the last two months is so steep that a valid trend line cannot even be drawn from the recent top. The best we can do is to draw a potential channel outlined in brown, which represents the current intermediate downtrend.
This is not the chart of an index which has made a low. At the very least, it will have to break out of the brown channel before we can say that a temporary low is in place.
The indicators are confirming this. The MACD (on top) is still heading down with no real sign of deceleration, and the momentum indicator (below) has only bounced up due to an extreme oversold condition.
The daily chart shows that the SPX came out of its next steepest channel (black), and extended its rally to 135 points. On Friday it reached the crest of the previous rally as well as a (blue) trend line -- both of which representing resistance -- and started to back-off.
Both indicators demonstrated some good divergence at the low of the move and signaled that a rally was coming, but now they are overbought and could be saying that a pull-back is needed before we can move higher. The fact that they are not showing negative divergence at this time, means that the pull-back may only be mild. But with the current volatility, we could easily produce a sell signal if we have a 50-point decline and close on the day's low!
The hourly chart can shed more light on the immediate market position. The index broke out of the black channel and moved up to the blue trend line and former top resistance which was also in the vicinity of a projection (horizontal pink line). Both indicators show negative divergence and signal the probability of a consolidation/correction directly ahead.
To give a bona fide sell signal, we would have to move below the red horizontal line which is at 922. If we don't, we risk a move past the blue trend line to the pink line projection above (1055). If we move below and keep going, the projection would be about 794, which also corresponds to an unfilled P&F target.
Cycles
The 7-yr cycle probably bottomed on 10/10 and has restrained the 6-yr which may not make its low until the middle of November. If you recall, that was the original idea expressed several months ago, except that this was supposed to happen at a much higher level, limiting the decline to an intermediate-term correction. If the 6-yr does make its low in November, or has already bottomed, the two cycles combined could support a rally of several weeks.
The 9-mo cycle is due in mid-November, as well as a smaller cycle and a minor cycle.
Projections:
The short-term projections are shown on the hourly chart, above, depending on which way the short-term trend resolves itself. Reaching the lower target would require that the S&P make a new low.
Breadth
The hourly breadth indicator, as you can see on the chart, has already rolled over, with the raw data in a position of negative divergence.
The daily breadth is overbought and needs to correct, which we cannot do without prices retracing as well.
The McClellan Summation index (courtesy of StockCharts) has just started to turn up from a lower low. This confirms the view that we could have seen a short-term low which has not completely run its course, but it does not tell us that an intermediate-term bottom is in place. I would prefer to see some positive divergence develop in this indicator before calling for a good low which will produce a rally lasting several weeks.
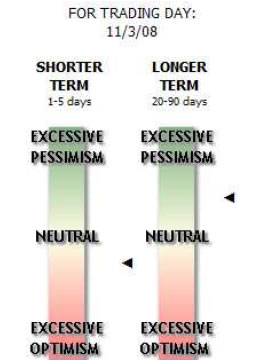
Market Leaders and Sentiment
The sentiment indicator (courtesy Sentiment Trader) has lost some of its intermediate bullishness and is now showing some short-term bearishness. This probably means that a pull-back is ahead and matches what other short-term indicators are saying.
Neither the NDX, nor the Russell 2000 are suggesting that we are near a very important reversal of the downtrend.
Summary
We are currently in a bear market rally. There is a possibility that an intermediate low was made on 10/10, but this remains to be confirmed.
The following are examples of unsolicited subscriber comments:
What is most impressive about your service is that you provide constant communication with your subscribers. I would highly recommend your service to traders. D.A.
Andre, you did it again! Like reading the book before watching the movie. B.F.
I would like to thank you so much for all your updates/newsletters. As I am mostly a short-term trader, your work has been so helpful to me as I know exactly when to get in and out of positions. I am so glad I decided to subscribe to Turning Points… Please rest assured that I shall continue to be with Turning Points for a long time to come. Thanks once again! D.P.
But don't take their word for it! Find out for yourself with a FREE 4-week trial. Send an email to ajg@cybertrails.com .
By Andre Gratian
MarketTurningPoints.com
A market advisory service should be evaluated on the basis of its forecasting accuracy and cost. At $25.00 per month, this service is probably the best all-around value. Two areas of analysis that are unmatched anywhere else -- cycles (from 2.5-wk to 18-years and longer) and accurate, coordinated Point & Figure and Fibonacci projections -- are combined with other methodologies to bring you weekly reports and frequent daily updates.
“By the Law of Periodical Repetition, everything which has happened once must happen again, and again, and again -- and not capriciously, but at regular periods, and each thing in its own period, not another’s, and each obeying its own law … The same Nature which delights in periodical repetition in the sky is the Nature which orders the affairs of the earth. Let us not underrate the value of that hint.” -- Mark Twain
You may also want to visit the Market Turning Points website to familiarize yourself with my philosophy and strategy.www.marketurningpoints.com
Disclaimer - The above comments about the financial markets are based purely on what I consider to be sound technical analysis principles uncompromised by fundamental considerations. They represent my own opinion and are not meant to be construed as trading or investment advice, but are offered as an analytical point of view which might be of interest to those who follow stock market cycles and technical analysis.
Andre Gratian Archive |
© 2005-2022 http://www.MarketOracle.co.uk - The Market Oracle is a FREE Daily Financial Markets Analysis & Forecasting online publication.