


Stock Market Correction Targets Retest of the Lows
Stock-Markets / Stocks Bear Market Jan 11, 2009 - 07:00 PM GMTBy: Andre_Gratian

 Current Position of the Market
SPX: Long-term trend -
Down! The very-long-term cycles have taken over and if they make their lows when expected, the bear market which started in October 2007 should continue until 2012-2014. This would imply that much lower prices lie ahead.
SPX: Intermediate trend - An intermediate low may have been reached in November, but this remains to be confirmed. There is good possibility that January 2009 will bring a new low, or at least a test of the lows.
Analysis of the short-term trend is done on a daily basis with the help of hourly charts. It is an important adjunct to the analysis of daily and weekly charts which determines the course of longer market trends.
Daily market analysis of the short term trend is reserved for subscribers. If you would like to sign up for a FREE 4-week trial period of daily comments, please let me know at ajg@cybertrails.com .
Overview:
After a last gasp past the 918 double-top, to 942, the SPX has made a reversal which looks significant. In the last newsletter, I stated: "With the wedge pattern apparently already complete, we can disregard the previous potential projection to 935-950." I made that projection several weeks ago for the end of the rally from 741. I should have held on to it one week longer!
The SPX met its target with very overbought indicators which needed to correct. That correction has begun and we'll soon find out how severe it will be. Elliott Wave analysts are divided on whether the structure from the October 2007 entails a completion of wave 3, or if that is still ahead -- or if the entire decline is an impulse wave, for that matter. Should it be the former, we are simply expanding the base by making a test of last November's low. If the latter, we should be heading for a new low.
Recently, I suggested that we might have found an intermediate low on 11/21 because the 7-yr and 6-yr cycles had made their lows at the end of 2008. I thought that these important cycles should be able to support a longer price recovery than we have had up to the present, but the overbought condition of the market still called for a pull-back which would result in a test of the lows. We are about to verify that suggestion, as well as clarify the Elliott Wave structure.
Whether or not the decline which we just started leads to a new low or only to a test of 741, we can be certain that the next rally -- although still a rally in a bear market -- will be far more substantial than the one which currently ended. For those who trade the intermediate trend, it should afford them an opportunity to trade the long side of the market.
What's ahead?
Chart Pattern and Momentum
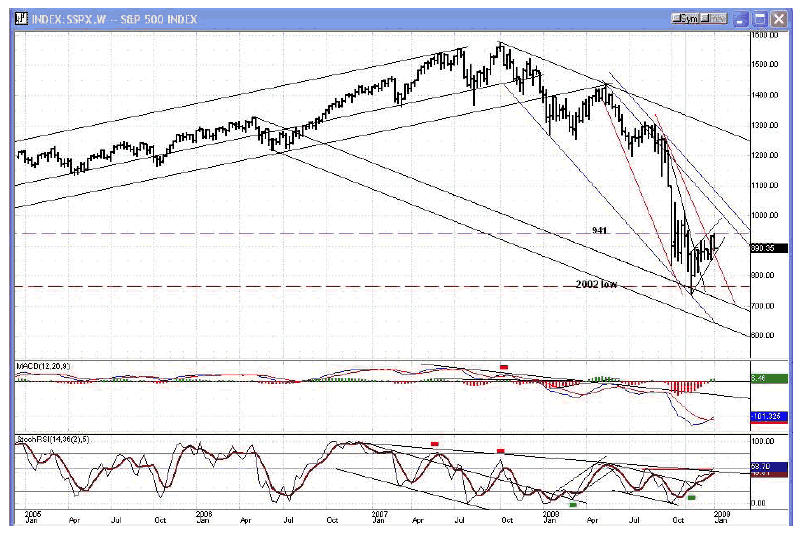
Starting with the SPX weekly chart, we can better see the wedge pattern that we have most likely completed (this time). On the chart, I have drawn various channels which represent various stages of the decline. The black trend lines on the outside probably represent the major bear market channel which, as you can see, is nowhere near ready to be challenged. We recently broke out of the red channel, which implied that we might continue on to challenge the blue one before turning down again, but last week the index met with resistance which dates back to the 2002 bottom formation and which also corresponded to the given projection. This proved to be too much, and it stopped the rally.
The bottom indicator is also at the top of a down channel, and although it is still moving up and may continue to do so for another week, it will not signal an important breakout.
What it is doing, however, is setting up some positive divergence to the price index and warning us that the next low should be more substantial and will have a better chance of initiating a rally of greater magnitude.
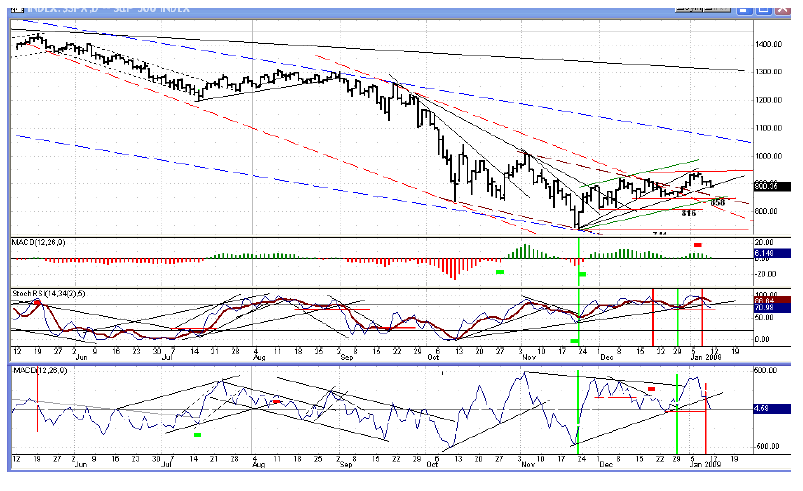
On the daily chart, the index is on the verge of breaking an up-trend line from the low of 741. When it does, it will have several layers of support underneath. First, the three former lows of 858, 816 and 741. It should also find support on the back of the two channels out of which it just moved. The top line of these 2 channels are represented by a brown and a red dashed line. If it is in the process of making a wave 5 (of 3), over the next month it will have to go below every single one of these to make a new low. If the decline is arrested by one of these support levels or lines, we have completed the 5th wave at 741. The decline will reverse when the daily indicators are, once again, in a buy position. The lower (breadth) indicator is already back to neutral. The momentum indicator is just beginning to correct.
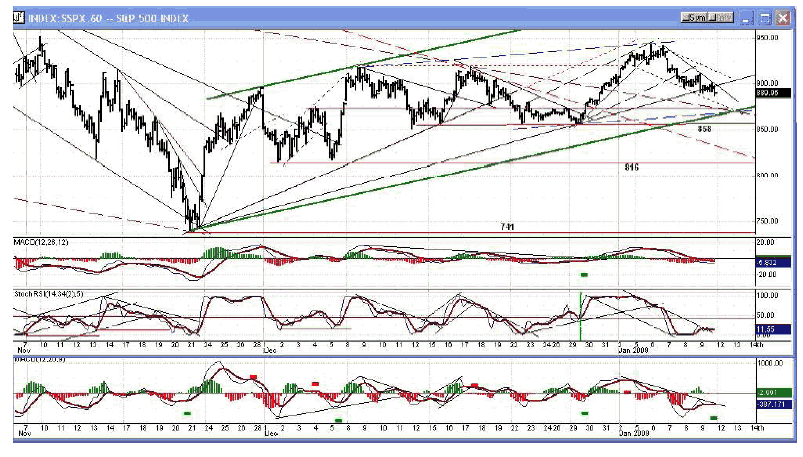
We'll now look at the hourly chart of the index (above). Two very important aspects of this chart immediately get our attention.
1) The indicators have not given a buy signal, but they could be ready in a matter of hours because they are oversold and positive divergence is beginning to appear.
2) There is a convergence of several support lines at about 870.
If we find support at 870 with the hourly indicators in a buy position, we will initiate a rally. The strength of that rally will give us a good clue as to whether the decline from 942 is only a test of the 741 low, or the beginning of a 5th wave which will create a new low.
Cycles
In the last newsletter I wrote: "The next 6-wk cycle is due at the end of the month, along with a minor cycle. If they are going to have an impact on prices, the sideways move of the last few days is just about over." And an impact on prices they did have, with an 85 point rally in the SPX. This was the "Santa Claus rally", partially a by-product of bullish seasonality, but its strength is what led me to suggest that 11/21 might have been something more than a minor bottom. And this is why we need to observe closely the action of the index between now and the end of the month.
Feb. 16th, will be 18 months from the 4.5-year Hurst cycle which bottomed on August 16, 2007. Assuming that it bottoms exactly on time and has an impact on the market -- the 9-month had no impact on its scheduled date-- the 18-month cycle should mark the bottom of this decline.
There is a minor cycle bottoming on Tuesday which could correspond to the index, reaching the 870 level.
Projections:
- A Point & Figure target to 878 also corresponds to a Fibonacci projection.
- There is a Point & Figure projection to 870.
- If the SPX retraces below the 858 support, the next target would be 814.
- If the index goes below 741, the next low could be about 640.
Breadth
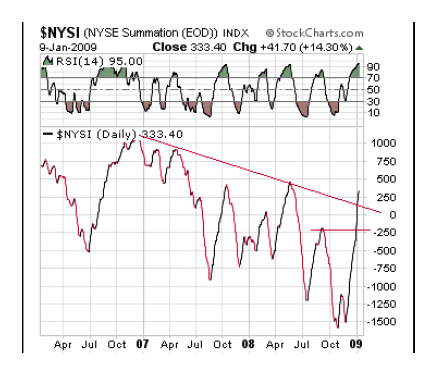
There has been a substantial improvement in the intermediate A/D condition, as you can see on the chart above. This is the McClellan Summation Index (courtesy of StockCharts). In one fell swoop it went positive, overcame the former top, and broke out of its downtrend. This is another reason to suspect that the 11/21 low may have been a low of intermediate degree, and if it is not, the next low will surely be. Note also that the RSI at the top is very overbought and needs to correct, which confirms the need for the market to correct.
As was pointed out earlier, the daily index had become overbought and has returned to neutral. When it reaches its lower range in conjunction with the momentum index, it will trigger another buy signal.
The hourly A/D indicator is very close to a buy signal, time-wise.
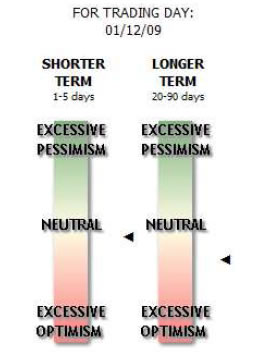
Market Leaders and Sentiment
According to "Sentiment Trader", investor sentiment for the longer term has gotten mildly negative. This confirms the readings of other daily technical measurements which call for a price retracement.
The shorter term, at neutral, reflects the fact that the hourly indicators are not quite ready for a buy signal.
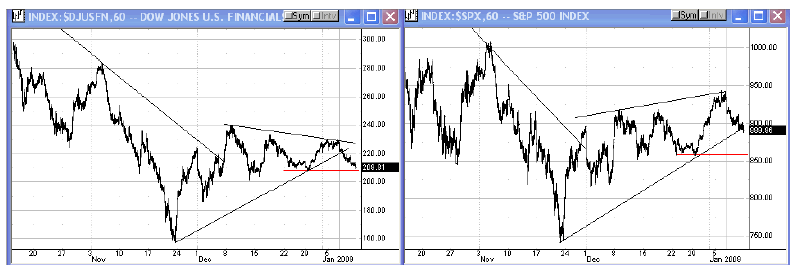
As you can see below, the Financial index is leading the SPX lower -- a negative!
Summary
The SPX met its short-term projection in an overbought condition, and this has brought an end to the rally from 11/21 and a need to consolidate. It is too soon to tell if the decline will reach new lows but, time-wise, it should continue at least until the end of the month and possibly until mid-February.
The following are examples of unsolicited subscriber comments:
What is most impressive about your service is that you provide constant communication with your subscribers. I would highly recommend your service to traders. D.A.
Andre, you did it again! Like reading the book before watching the movie. B.F.
I would like to thank you so much for all your updates/newsletters. As I am mostly a short-term trader, your work has been so helpful to me as I know exactly when to get in and out of positions. I am so glad I decided to subscribe to Turning Points… Please rest assured that I shall continue to be with Turning Points for a long time to come. Thanks once again! D.P.
But don't take their word for it! Find out for yourself with a FREE 4-week trial. Send an email to ajg@cybertrails.com .
By Andre Gratian
MarketTurningPoints.com
A market advisory service should be evaluated on the basis of its forecasting accuracy and cost. At $25.00 per month, this service is probably the best all-around value. Two areas of analysis that are unmatched anywhere else -- cycles (from 2.5-wk to 18-years and longer) and accurate, coordinated Point & Figure and Fibonacci projections -- are combined with other methodologies to bring you weekly reports and frequent daily updates.
“By the Law of Periodical Repetition, everything which has happened once must happen again, and again, and again -- and not capriciously, but at regular periods, and each thing in its own period, not another’s, and each obeying its own law … The same Nature which delights in periodical repetition in the sky is the Nature which orders the affairs of the earth. Let us not underrate the value of that hint.” -- Mark Twain
You may also want to visit the Market Turning Points website to familiarize yourself with my philosophy and strategy.www.marketurningpoints.com
Disclaimer - The above comments about the financial markets are based purely on what I consider to be sound technical analysis principles uncompromised by fundamental considerations. They represent my own opinion and are not meant to be construed as trading or investment advice, but are offered as an analytical point of view which might be of interest to those who follow stock market cycles and technical analysis.
Andre Gratian Archive |
© 2005-2022 http://www.MarketOracle.co.uk - The Market Oracle is a FREE Daily Financial Markets Analysis & Forecasting online publication.