


Trading Gold Using Gold Stocks as an Leading indicator
Commodities / Gold & Silver 2009 Jan 15, 2009 - 10:20 AM GMTBy: Chris_Vermeulen

 I find from time and time that gold stocks tend to lead the price of gold during extreme times and as I mentioned in last weeks report the HUI index has warned us up to 7 days in advance, before gold made sizable drop. Well this week is a perfect example in my opinion.
The charts below show how gold stocks became bearish much quicker than the price of gold indicating we should see lower gold prices soon. This time the HUI index gave us 5 days advance warning that gold will eventually drop quickly to catch up and the chart below show this.
Hello, I'm Chris Vermeulen founder of TheGoldAndOilGuy and NOW is YOUR Opportunity to start trading GOLD, SILVER & OIL for BIG PROFITS. Let me help you get started.
How to Improve You Exits for Gold Trades
- Use the next higher time frame chart for spotting key support and resistance levels.
- When Gold, Silver or Oil is near these S/R levels look for their stocks to shift momentum and start to reverse and breakdown. This is when you want to take profits.
Note: If the price reverses at or near the support trend line, adding to your position is always an option as long as you are within 3-5% of your trend line stop price.
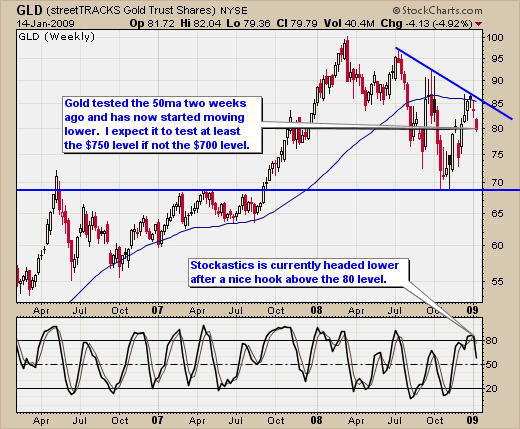
Longer Time Frame Chart of Gold – Weekly
Gold Stocks as a Leading Indicator – Daily Chart – Trading Signals
Gold stocks have the tendency for smart money moving in and out just before gold makes its move. This sends stocks drastically higher or lower and gives us the warning. This is something that I have traded for a long time and if I have a large portion of my portfolio in gold I like to lock in profits when it looks like stocks are topping. I would rather take a profit and see gold continue higher with the balance of my invested money, than see gold correct and for me to give back all the gains.
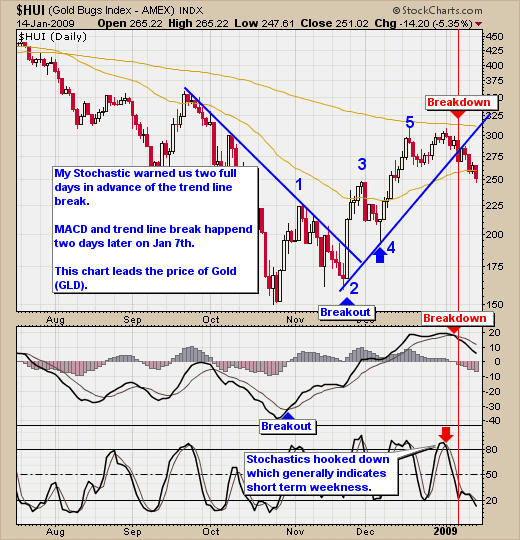
That being said lets get on with the charts. I do apologize for all the annotations on the charts. I really do hate a chart crammed with stuff but I want to try to get the basic point across although I am just scratching the surface here. The chart below is of the HUI Gold Bugs (Gold Stocks Index). As you can see there are several things happening on the chart, from the basic wave count to a simple stochastic indicator and MACD. But I am going to focus on the price action mainly for this live example.
The gold bugs index made a double top and closed below our support trend line 3 days later. That trend line breakdown also made the MACD & Stochastic cross giving us 2 more reasons to think we are going to see lower gold prices. The key here is to notice that the trend line was broken on Jan 7th with all my indicators going negative.
Gold Stocks Leading the Price of Gold – Daily Chart
Gold Lags Gold Stocks by 5 Days – Daily Chart
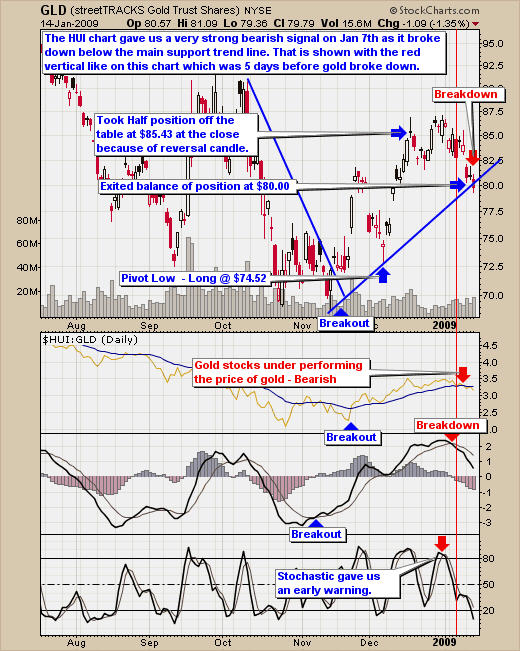
Gold held is value above our support trend line on Jan 7th while gold stocks had made a much larger move and closed below its trend line. What I like to do with this type of situation is exit the balance of my position. I generally like to give my positions the benefit of the doubt but when gold stocks start to go sour, I like to protect my profits. This is called “technical risk management” and it can boost returns by 1-5% per trade if done properly. For this trade alone it would have given us and extra 3.6% profit.
This chart below shows where we had a sell signal for gold if we used the HUI as our exit signal. It is 5 days before GLD broke our support trend line.
Gold GLD Lagging Gold Stocks to Our Advantage - Daily Trading Chart
Conclusion: Trading Gold Using Gold Stocks as an Indicator
Trading is difficult, but following a set of parameters and using the proper type of risk management for that strategy is EXTREMELY difficult. This is where most people fail and mi not afraid to admit I make several mistakes trading each year. Once you toss real money into gold, silver, oil or any investment vehicle most people start to see the charts backwards. I have this problem all the time because I look at charts all day and some times I start to wonder what I am even looking at. That's when I take my dog for a walk to get a fresh mind. Also writing down your trading setup with your goal to take partial profits as well as setting your stop order is crucial to staying on track. This is just scratching the surface of improving your exit strategy but it will make you a lot of money when trading gold.
I have put together a package for yearly subscribers which is if you join for a year ($299) I will send you $300 in gas vouchers FREE which are valid at the major gas stations in USA & Canada. Valid At: Chevron, Texaco, Sunoco, CITGO, Mobil, Esso, Shell, BP, And More...
If you interested please act fast as I only have a few of these gas vouchers before they are gone for good.
If you have any questions please feel free to send me an email. My passion is to help others and for us all to make money together with little down side risk.
I look forward to hearing from you soon!
For more information, questions or to receive my Free Weekly Special Report please visit my website: www.TheGoldAndOilGuy.com
By Chris Vermeulen
Chris@TheGoldAndOilGuy.com
Please visit my website for more information. http://www.TheGoldAndOilGuy.com
Chris Vermeulen is Founder of the popular trading site TheGoldAndOilGuy.com. There he shares his highly successful, low-risk trading method. For 6 years Chris has been a leader in teaching others to skillfully trade in gold, oil, and silver in both bull and bear markets. Subscribers to his service depend on Chris' uniquely consistent investment opportunities that carry exceptionally low risk and high return.
This article is intended solely for information purposes. The opinions are those of the author only. Please conduct further research and consult your financial advisor before making any investment/trading decision. No responsibility can be accepted for losses that may result as a consequence of trading on the basis of this analysis.
Chris Vermeulen Archive |
© 2005-2022 http://www.MarketOracle.co.uk - The Market Oracle is a FREE Daily Financial Markets Analysis & Forecasting online publication.