


U.S. Economic Weakness Unmatched in 35 Years
Economics / Recession 2008 - 2010 Feb 17, 2009 - 06:02 AM GMTBy: John_Mauldin

 One of the best gauges of an economy is tax collections. No one pays taxes unless they have to, so collections are a real-world, real-time analysis of the US economy. And the best source I know of for tracking taxes is The Liscio Report, by Philippa Dunne & Doug Henwood.
Tax collections are down. Philippa and Doug give us the actual numbers, which are not pretty. Bottom line? "What does this all mean? It suggests that the consumer retrenchment in this recession will be deep and long, and will probably continue into any recovery. The American consumer is no longer the world consumer of last resort, and that's an enormous change for both this country and the rest of the world to get used to."
You can learn more about the Liscio Report at www.theliscioreport.com. Enjoy your week.
John Mauldin, Editor
Outside the Box
Holiday Blues: Weakness Unmatched In 35 Years
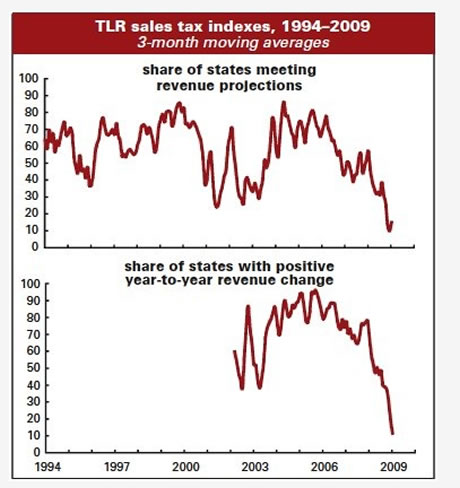
In January, 21% of the states in our survey met or exceeded their forecasted sales tax collections, up from 9% in December. Our index is based on states meeting their forecasts, not reporting strong or even positive over-the-year collections, so we need to point out that the entire improvement came from a large state doing slightly better than the stunning decline they had forecast. This decline was partially calendar related, but January 2008 was 7% below forecast, so they had a very low bar. In the words of our contact in that state: "Bad economy, good forecast." Had the revenue estimators in that state made a less dramatic forecast our survey would have slid to 6%, which we think is more in line with historical weakness reported for sales tax collections during the holiday season.
States reporting over-the-year growth fell to 3% from 15% in December. The average decline, weighted by state population fell from December's –6% to –10%. (More on this in a bit.) Forecasts were negative in all but two of the states that met their projected collections. The exceptions include a state that collects sales taxes on groceries and attributes their relative strength to the spike in food prices, and another that put through a rate increase, which accounts for all of the growth.
The energy-extraction states, which have held up the longest, are now weakening as well. To give you an idea of how powerful the surge in energy prices has been, our contact in one southern state told us that their Appalachian mine country is currently outperforming regions where manufacturing and research predominate.
Throughout the country, states are reporting historic weakness. One Midwestern state reported two months of double-digit declines, which just three months ago would have been "unthinkable." A small southern state reports that never before has an entire year fall below the prior year; they are currently down 5.7% for the year, and have to go back 35 years to find similar monthly weakness. Calling the holiday season one "large discretionary item," our contact in a large Midatlantic state reports that that item "imploded like never before" in his forty years of data. "Holiday receipts will make you say: OMG," he promised, even if you're too old to talk that way.
There is one piece of potentially encouraging news. A few contacts remarked that they do not expect the current rate of decline to continue into the spring as spending swings back toward day-to-day needs and away from the discretionary shopping of the holiday season. But, of course, there is no guarantee that consumer spirits will improve much with the job market in rapid decline, the markets in disarray, and our leaders struggling to come up with a viable plan to get the credit markets moving.
In addition to exceedingly weak sales receipts, our contacts are reporting record unemployment insurance payouts (in one state double what would formerly have been considered a "huge" month), plummeting corporate receipts, skyrocketing refunds, and evidence that withheld taxes may have been supported by employees opting out of retirement plan deductions, and even cashing out of 401K plans. (Hardship withdrawals trigger withheld taxes.)
Consumption: From Excess to Freefall
What's happened to consumption since the middle of 2008 is nothing short of stunning, both in speed and magnitude. Several examples will make this point.
Let's start with one of the mainstays of this report, sales taxes. Graphed below is the yearly change in state and local government (SLG) sales tax receipts adjusted for inflation from the national income accounts. (The price index is that for SLG purchases.)
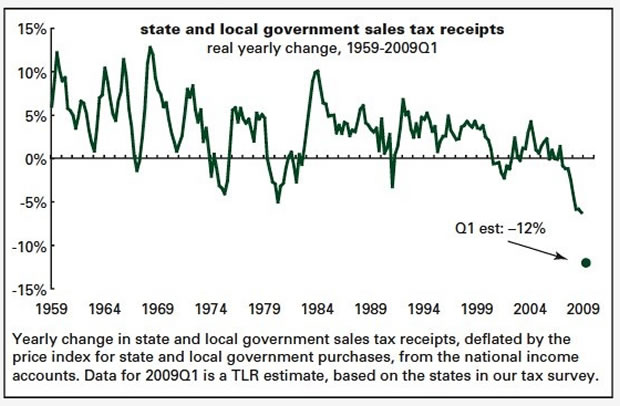
The last entry on the graph is our projection, based on the results of our January survey -- a 10% nominal decline with a 2-point inflation adjustment, or a 12% estimated decline. (The estimate of 2% inflation is rough; it was about 3% in the fourth quarter, down from around 6% at midyear.) The actual result for the fourth quarter of 2008 was –6.3%, a little worse than the previous two quarters, which came in at –5.9%. That –6% neighborhood for late 2008 is the worst in the history of the series; its closest rival is the –5.1% hit during the sharp 1980 consumer recession, when Jimmy Carter got on TV and told people that it was their patriotic duty to stop using their credit cards -- which they actually did for a while, though not for long. This quarter should shape up to be a record-breaker.
OK, moving on to auto sales. Graphed below are monthly unit sales at a seasonally adjusted annual rate per 1,000 people. Adjusting for population really brings home the weakness. January's 9.5 million rate (for autos plus light trucks) is one of the lowest in history, but its earlier rivals were at times when the U.S. population was considerably lower than it is today.
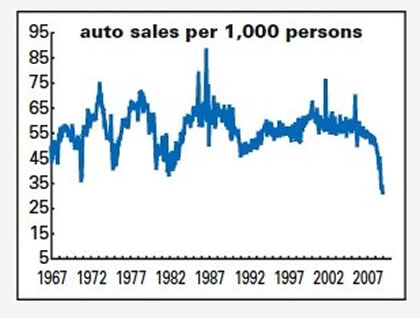
January's rate translates into 31.1 units per 1,000 people, which is 3.5 standard deviations below the mean, and well below November 1970's 36.1, a dismal performance created not by economic weakness, but by a two-month strike at GM. It's also worse than the lowest levels of the 1973–75 and 1981–82 recessions (40.8 and 38.3 respectively). It comes after a 17-year period when there was basically no auto recession. But the contraction has hit suddenly and hard: sales were 50.3 per 1,000 in February 2008. The yearly drop-off is the worst since the numbers begin in 1968.
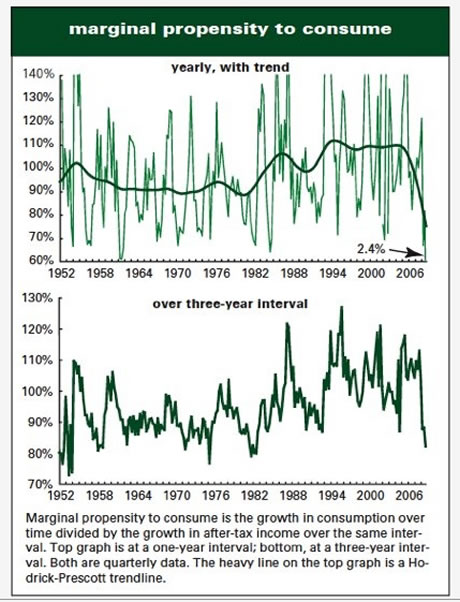
And now a macro measure: what Keynes called the marginal propensity to consume (MPC). The MPC is the share of after-tax income growth that is devoted to consumption. Between 1950 and 1990, the MPC was 89% (that is, the growth in consumption over those 40 years was equal to 89% of the growth in after-tax income). Americans started consuming more of their income growth in the 1990s, but really broke records in the 2000s.
Those points are illustrated by the graphs on below. The top graph shows the MPC computed over rolling one-year intervals. It's obviously very volatile, so we've added a trendline (as computed by a Hodrick–Prescott filter). In the 1980s, the HP trend broke above 100% for the first time, maxing out at 106% in 1986. It fell back to just below 100% as the decade turned, but began rising again in 1991. It stayed above 100% until mid-2006, and has now fallen very sharply to 75%. The actual MPC for the fourth quarter of 2008 was 2.4%, the lowest by far since 1950.
The graph on the bottom stretches the interval out to three years, to smooth out some of the volatility. That measure isn't at record lows, but its fall has been vertiginous: from 113% at the end of 2007 to 82% at the end of 2008. Measured in percentage terms, that's the sharpest fall over the last 58 years.
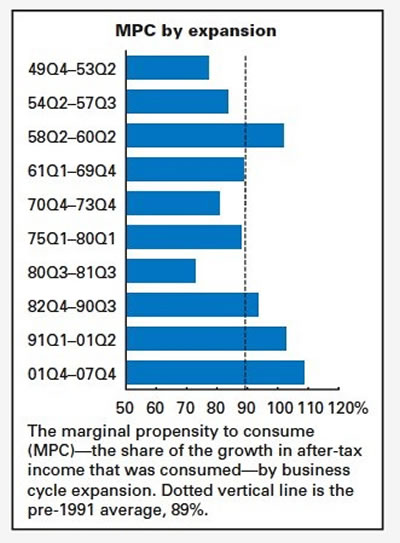
And the graph below shows the MPC by expansion, for the last 10 cycles. The MPC for the 2001–2007 expansion was 108%, a record by a comfortable margin. The #2 slot is occupied by the 1991–2001 expansion's 102%. Aside from the late 1950s expansion, nothing else came in above 100%.
What does this all mean? It suggests that the consumer retrenchment in this recession will be deep and long, and will probably continue into any recovery. The American consumer is no longer the world consumer of last resort, and that's an enormous change for both this country and the rest of the world to get used to.
Thursday's retail numbers
As we often point out, the retail sales series is extremely noisy, so noisy in fact that its month-to-month serial correlation is negative or non-existent. Stringing together the old and new series since 1967 gives you a serial correlation of –0.198 for the headline and –0.154 ex-auto; just looking at the new, post-1992 series, the coefficients are –0.151 and 0.032. This compares to the nonfarm payrolls correlation of +0.707.
This is by way of preface to saying that it's unusual to have several consecutive months of steep declines, as we have in recent months, but certainly not surprisingly in these unusual times (something to be thankful for in five or ten years, we hope).
Although our sales tax survey is abysmal, collections are lagged and we have seen some of that weakness in December's retail numbers. We suspect January sales fell -0.3% and –0.2% stripping out autos. The standard private surveys suggest that January wasn't as bad as December; the Goldman Sachs–ICSC weekly chain store numbers have stabilized (at low levels, suggesting necessities, not indulgences) in recent weeks. Our headline is far from consensus because we understand that weakness in unit auto sales was largely driven by fleet sales. The Census Bureau instructs retailers to include fleet sales in their responses, but since these sales usually bypass retail outfits they are probably more often missed than included.
--Philippa Dunne & Doug Henwood
By John Mauldin
John Mauldin, Best-Selling author and recognized financial expert, is also editor of the free Thoughts From the Frontline that goes to over 1 million readers each week. For more information on John or his FREE weekly economic letter go to: http://www.frontlinethoughts.com/learnmore
To subscribe to John Mauldin's E-Letter please click here:http://www.frontlinethoughts.com/subscribe.asp
Copyright 2008 John Mauldin. All Rights Reserved
John Mauldin is president of Millennium Wave Advisors, LLC, a registered investment advisor. All material presented herein is believed to be reliable but we cannot attest to its accuracy. Investment recommendations may change and readers are urged to check with their investment counselors before making any investment decisions. Opinions expressed in these reports may change without prior notice. John Mauldin and/or the staff at Millennium Wave Advisors, LLC may or may not have investments in any funds cited above. Mauldin can be reached at 800-829-7273.
Disclaimer PAST RESULTS ARE NOT INDICATIVE OF FUTURE RESULTS. THERE IS RISK OF LOSS AS WELL AS THE OPPORTUNITY FOR GAIN WHEN INVESTING IN MANAGED FUNDS. WHEN CONSIDERING ALTERNATIVE INVESTMENTS, INCLUDING HEDGE FUNDS, YOU SHOULD CONSIDER VARIOUS RISKS INCLUDING THE FACT THAT SOME PRODUCTS: OFTEN ENGAGE IN LEVERAGING AND OTHER SPECULATIVE INVESTMENT PRACTICES THAT MAY INCREASE THE RISK OF INVESTMENT LOSS, CAN BE ILLIQUID, ARE NOT REQUIRED TO PROVIDE PERIODIC PRICING OR VALUATION INFORMATION TO INVESTORS, MAY INVOLVE COMPLEX TAX STRUCTURES AND DELAYS IN DISTRIBUTING IMPORTANT TAX INFORMATION, ARE NOT SUBJECT TO THE SAME REGULATORY REQUIREMENTS AS MUTUAL FUNDS, OFTEN CHARGE HIGH FEES, AND IN MANY CASES THE UNDERLYING INVESTMENTS ARE NOT TRANSPARENT AND ARE KNOWN ONLY TO THE INVESTMENT MANAGER.
John Mauldin Archive |
© 2005-2022 http://www.MarketOracle.co.uk - The Market Oracle is a FREE Daily Financial Markets Analysis & Forecasting online publication.