


Protect Your Wealth from Collapsing Monetary Systems
Commodities / Fiat Currency Feb 20, 2009 - 09:49 AM GMTBy: Oxbury_Research

 “How To Preserve Wealth During Crises... And Why Central Banks Are Bad For Your Financial Health”
Last week we talked about the grave dangers of a Depression and recent media discussion as to whether or not we're about to enter one (or already are). That of course raises the question: if worst comes to worst, how did investors survive the last one?
We don't have the time or space to go into every possible detail of a comprehensive comparison and contrast between the 1930's and today. Instead, let's focus our efforts and take a look at historical charts like this one:
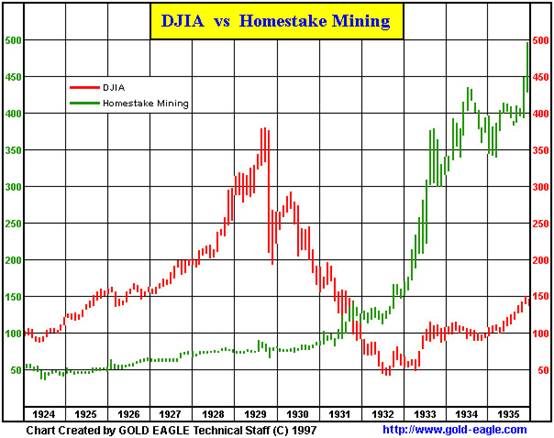
If you were wondering, Homestake was one of the largest gold mining businesses in America from 1879 through to 2002 when it merged into Canadian-based Barrick Gold Corporation. This makes it the longest-listed stock in the history of the NYSE, and as you can see, it did pretty much nothing during the stock market hysteria of the 1920's ... then surged impressively as the rest of the economy went into the toilet.
Even if you rode the DJIA down from its highs and only bought Homestake at the time of the DJIA/Homestake crossover in the latter half of 1931, you would have made about four times your money back by the end of 1935.
Granted, you would have lost as much as two-thirds of your initial DJIA investments first (if you bought near the top of the mania and rode down to the crossover). This would have given you a lot less money to buy Homestake, but on the bright side you more than made back the losses by investing in a well-managed and dominant gold mining company.
A Quick (Relatively) Recent History Lesson
Also, bear in mind these gains occurred in spite of :
1) FDR ordering that all gold coins and gold certificates in denominations of more than $100 be redeemed for other money in April, 1933.
2) The government seizing $300 million in gold coins and $470 million in gold certificates by mid-May, and
3) FDR taking America off the gold standard in June when a joint resolution of Congress terminated public and private obligations requiring a debtor to repay creditors in gold dollars
And what's more: in 1934, the government price of gold was increased to $35 per ounce, which boosted the value of the Fed's freshly filled gold coffers by 69% (while simultaneously robbing the prior holders of these gains).
This was nothing but legalized theft, of course. But take a look at the Homestake chart again. It kept going up despite these shenanigans . And it was going up before FDR committed grand theft by confiscating and then re-valuing physical gold.
A Quick (Not So) Recent History Lesson
But it's a bit unfair to blame FDR alone for horrors regarding gold and financial stability. Every other thief of the era was trying pretty much the same thing now that central banking was seizing real power in the economy.
Take a good long look at this gold price chart since 1344 A.D. to see the horrors wrought by central bankers and governments who claimed that gold was “too restrictive” a system for a modern civilization (Chart Source: http://www.chartsrus.com):
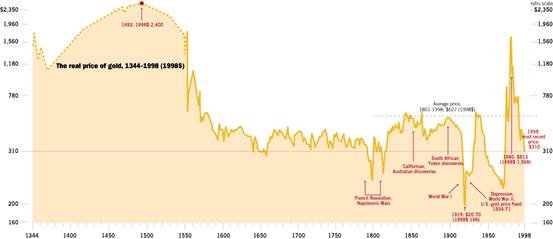
Note that from 1600 onwards, even the French Revolution (a massive sea change in the history of Europe ) caused relatively minor price fluctuations and the bedrock of the global financial system was sound and secure.
When did it begin gyrating wildly? Right when the UK "temporarily" went off the gold standard in 1914 to fight World War I and then used its new financial "freedom" to devalue the currency so badly that when the standard was re-implemented in 1925 it marked the beginning of the end of the British Empire .
In fact, the British fiscal responsibility was so poor that it finally abandoned the standard in 1931 followed by most other European nations. And that only encouraged further crazy price swings in an asset which had been the paragon of stability for centuries .
The truth is, gold was (and is) still a highly stable asset . What's fluctuating like a crazy metronome is the value of what it's measured against : paper money. The long, long chart above only goes to 1998 but it doesn't take a genius to figure out that gold will adhere to its mean value even while paper burns.
For example, examine this CPI and PPI chart since 1982 to see what's happened to the purchasing power of a U.S. dollar in recent years:
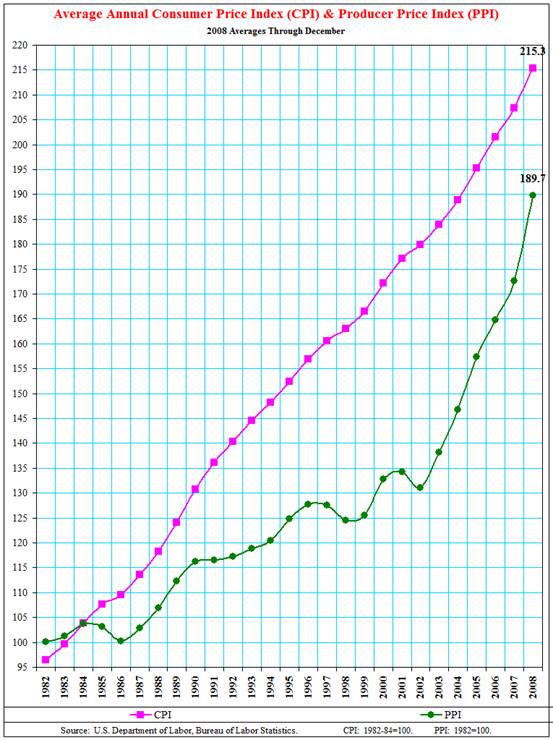
From 1998 onward (1998 being the end of the centuries-long gold chart), the purchasing power of a dollar as measured by CPI has dropped by almost 25%. Do you think it's any coincidence that gold is hitting new highs against the dollar (and pretty much every other paper currency) even as the CPI rises?
So Where's Today's Homestake Mining Equivalent?
There's a lot more information on gold mining available today than during the 1930's Depression, as you might have guessed. Almost too much.
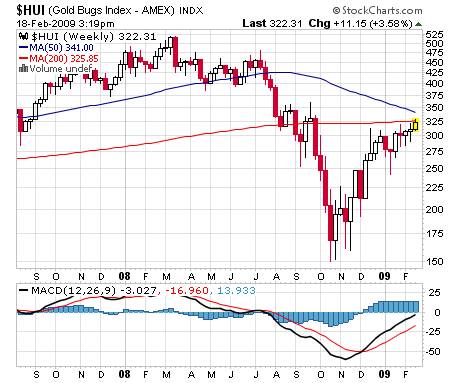
However, one of the most recognized indexes of major gold mining companies is the HUI Gold Bugs Index on the AMEX (table from www.amex.com).
As you can see, the HUI was dragged down with everything else during last year's downturn (most likely due to hedge funds being forced to bail out of over-leveraged positions) but it's bouncing back quite strongly. With the 50 week and 200 week moving averages hovering in the vicinity, it's likely that the HUI will encounter some heavy resistance as it tries to push through.
However, refer to the Homestake Mining vs. the DJIA chart at the beginning of this report. Any weakness in gold (and major gold mining shares) is only temporary and should be considered a buying opportunity for the HUI itself or selected stocks in that index.
While everyone else watches the Dow descend to unthinkable depths over the next few years, the HUI is likely to be setting record highs as today's high priests of the failed Keynesian economics cult burn your precious dollars on the altar of “progress” and “stabilization”.
We recommend you protect yourself and prosper.
Turn a negative into a positive, and enjoy the benefits of an asset with centuries of proof backing it as the best way to maintain (and grow) your wealth during the hard times which are sure to be ahead.
Good investing,
Disclosure: no positions
Nick Thomas
Analyst, Oxbury Research
Nick Thomas is a seasoned veteran of technical analysis and has mastered all intra-day trading in stocks, options, futures and forex. He prefers to scout investments as one asset class of many and shapes his investment strategies accordingly. He writes extensively about offshore banking and offshore tax havens and is active in the career development field of independent investment research.
Oxbury Research originally formed as an underground investment club, Oxbury Publishing is comprised of a wide variety of Wall Street professionals - from equity analysts to futures floor traders – all independent thinkers and all capital market veterans.
© 2009 Copyright Oxbury Research - All Rights Reserved
Disclaimer: The above is a matter of opinion provided for general information purposes only and is not intended as investment advice. Information and analysis above are derived from sources and utilising methods believed to be reliable, but we cannot accept responsibility for any losses you may incur as a result of this analysis. Individuals should consult with their personal financial advisors.
Oxbury Research Archive |
© 2005-2022 http://www.MarketOracle.co.uk - The Market Oracle is a FREE Daily Financial Markets Analysis & Forecasting online publication.