


Silver Powerful Rally Reaches Strong Resistance Area
Commodities / Gold & Silver 2009 Mar 22, 2009 - 12:18 PM GMTBy: Clive_Maund

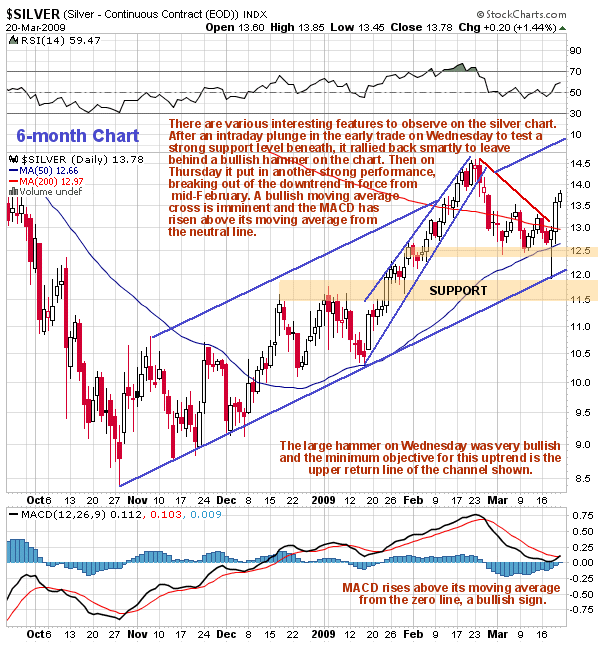
 We saw very bullish action in silver last week, although unlike gold, it has alot of resistance to contend with on the way up. On the 6-month chart we can see how silver plunged in the early trade on Wednesday to briefly touch a zone of strong support at and beneath its major uptrend channel support line, only to rally strongly later in the day on the Fed news to close up and near to the day's high, leaving behind a strong bullish hammer on the chart. This was followed by a strong up day that broke silver decisively out of the downtrend it had been in from mid - late February. It rose again on Friday and is now looking in need of a brief rest, although if the dollar picks up again on the downside, as look likely, it will simply continue higher.
It is interesting to observe that silver never closed below its 50-day moving average in recent weeks, which has clearly been providing support, and that this average is now poised to make a bullish cross soon above the 200-day, which will in due course result in the latter turning up, creating a more positive environment for silver to take on and overcome the considerable overhead resistance. Before leaving this chart notice how the MACD indicator at the bottom of the chart has turned up from the zero line and is rising through its own moving average, a development that frequently marks the start of a significant intermediate uptrend. The minimum objective for this uptrend is the channel return line, meaning that silver should at least reach the $15 - $15.30 area in coming weeks.
The 3-year chart is useful as it enables us to see what silver is going to have to contend with on the way up. As we can see, unlike gold, silver has alot of resistance to work its way through. The background for this is that silver took a much heavier beating than gold last year, on account of industrial demand for silver being a much more important component of its price determination than is the case with gold. The prospect of deflation and depression therefore took a much heavier toll on the silver price, although now investment demand is an increasingly important factor as silver's role as money and a store of value comes more to the fore. The core of the resistance lies between about $14.70 and $16.80 and it is this core resistance which is shown on the chart and it will likely take silver some time to work its way through this. It should be noted, however, that this applies with respect to the dollar chart. Plotted against other currencies such as the Swiss Franc, silver is alot closer to breaking free of overhanging supply.
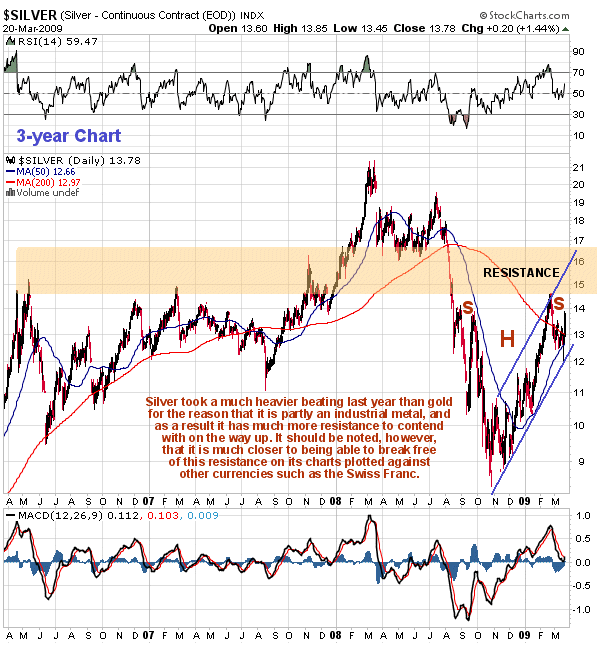
Another point worth observing is that the pattern that has formed from last August - September appears to be a large Head-and-Shoulders bottom, which is best seen on the 1-year chart, but can be made out on our 3-year chart. The pattern is heavily skewed on the chart for silver against other currencies on which it is not really visible. However, if this pattern is valid, its measuring implications call for an advance to the $25 area, probably later or late this year.
By Clive Maund
CliveMaund.com
For billing & subscription questions: subscriptions@clivemaund.com
© 2009 Clive Maund - The above represents the opinion and analysis of Mr. Maund, based on data available to him, at the time of writing. Mr. Maunds opinions are his own, and are not a recommendation or an offer to buy or sell securities. No responsibility can be accepted for losses that may result as a consequence of trading on the basis of this analysis.
Mr. Maund is an independent analyst who receives no compensation of any kind from any groups, individuals or corporations mentioned in his reports. As trading and investing in any financial markets may involve serious risk of loss, Mr. Maund recommends that you consult with a qualified investment advisor, one licensed by appropriate regulatory agencies in your legal jurisdiction and do your own due diligence and research when making any kind of a transaction with financial ramifications.
Clive Maund Archive |
© 2005-2022 http://www.MarketOracle.co.uk - The Market Oracle is a FREE Daily Financial Markets Analysis & Forecasting online publication.