


Stock Market Rally Some Room to Extend Further
Stock-Markets / Financial Markets 2009 Apr 04, 2009 - 03:14 AM GMT

 All day long on Friday indexes labored as if in a topping process. That would have been no surprise, since my model had been saying all along that the top of this rally would be 840-850 in the SPX and 1300-1315 in the NDX. I had given up earlier this week on the indexes achieving their target, although a close call. Today it achieved its target.
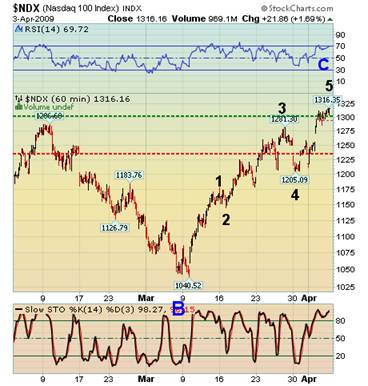
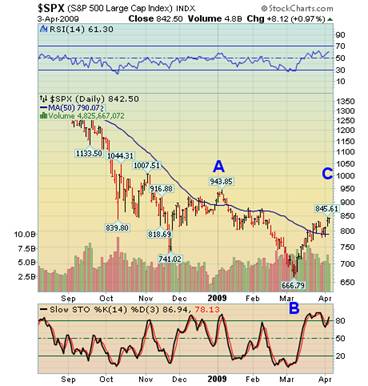
As we step back and look at the daily chart, the “impulse” that appeared to be the beginning of a reversal down was stopped by the 50-day moving average, the first time in this bear market. That is now support for the rally. Although overbought, it has some room to rally. In the ideal world, this wave should reach 950 or so. After several rounds of analysis, I have concluded that the top may be far shorter than that. For example, (a) = (c), a rule of thumb for corrective waves, at 915. If the SPX falls short of 943, it will be called an irregular correction. Read further below.
On a closer look, the Model is only begrudgingly giving up space for the rally to 848-855. I have simplified my wave count in that it makes the most sense, given the parameters of the Model. So, in other words, the rally may be weaker than most analysts imagine. Many are calling for 950 to 1000 and several prominent analysts are calling for the rally to extend until September. The Model is giving me too much dissonance to agree with those predictions at this time.
The NDX is already straining at resistance, which is at 1317. But there is one more fractal needed to finish wave 5. A brief pullback to 1275-1300 and one more probe into resistance may be all it needs. The top could be anywhere between 1317 and 1325. A look at the daily chart shows that it has a very “finished” appearance already. The final process could take a week or so, patience is needed. I am “stuck” with some small short positions taken late today, but I believe that a minor 4th wave pullback is imminent.
Contrary to what I had said earlier, this rally appears to be fizzling out far too soon to take advantage of it. If we are finishing an impulse to the upside, there is no profit in the long side now. Mistaking the decline to 1205 as the beginning of a larger correction kept me from recognizing the potential 5th wave that we have just seen. Again, we had an early cycle low that also skewed my view. But the bigger picture is what lies just “around the corner.” If my Model is guiding me correctly, the next decline may be the largest yet.
The next cycle bottom is due the first week of May. It will give us some idea how strong the next decline should be.
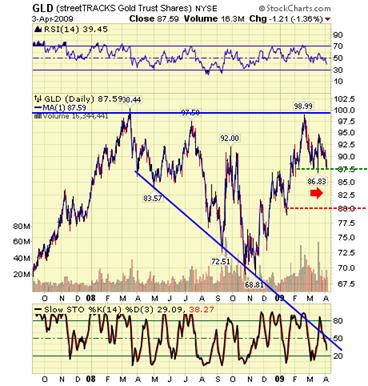
Here is a surprise for you. GLD is not declining as impulsively as I would have expected in a major decline. A step back to the daily chart reveals a horizontal expanding triangle, which has longer-term bullish implications. Right now my model still suggests a decline to 83 may be in the offing. The support zone that I have shown is the Fibonacci 382 retracement at 88 and the .618 retracement at 80. This can happen in a relatively short period of time, so I am suggesting being on the alert for GLD meeting its target and being ready to take advantage of the new rally as it turns…
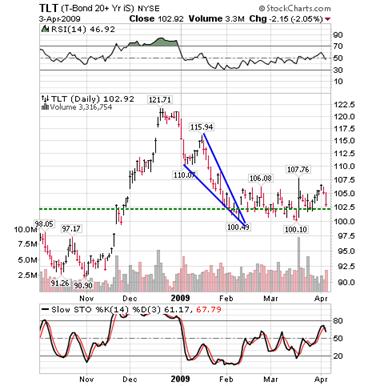
Some may be wondering why the big sell-off in TLT today. Well, so am I. So far there is no technical damage done. It may simply be a deep retracement. If so, then it should be on its way fairly quickly to new highs. One possibility is there may have been some effort to stifle bonds due to the G-20 meeting this weekend. In any event, there is some serious support at 102 that should hold. If not, we re-evaluate our intermediate-term outlook. I haven’t liked TLT’s performance lately, so I have stayed in cash for my bond allocation.
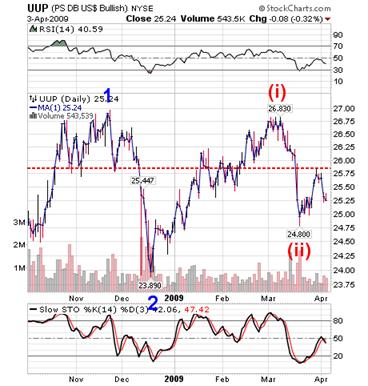
I am hard pressed to say whether UUP wants to rally now or continue its slide. The explanation for the recent weakness in the Dollar is the Euro has been very weak of late. It has declined twice to 125 and only recently rallied to about 135. The rally doesn’t look impulsive, so the Euro may collapse and with it, the European Union. The G-20 meeting may be more of an effort to keep the European alliance alive than to solve the world’s economic problems, IMO. The discord among the various countries may sharpen if investors continue to look to the U.S. as a safe haven regardless of the moves in equities. As they say, “Follow the money!”
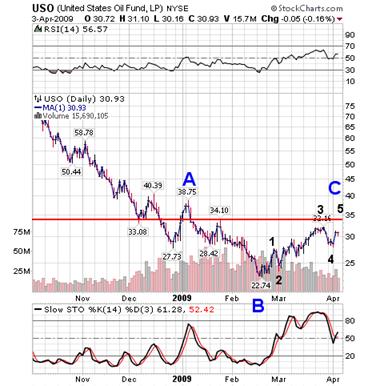
Just one more push up is all USO needs to complete its 5th wave of C. Because of the Model resistance, I suspect that wave C will be shorter than B, which is not terribly unusual. This pattern is called an irregular correction. The target for the final wave is 33-34.
This analysis has been a bit of an ordeal, since I have had to review and discard several closely held ideas about the market. I feel that the information that I am giving you now is more in sync with what has been happening rather than trying to fit my expectations over it. Although my practice has been profitable in the past two weeks, it could have been much more so by participating on the upside.
Enjoy your weekend and we’ll get busy again next week!
Our Investment Advisor Registration is on the Web .
We are in the process of updating our website at www.thepracticalinvestor.com to have more information on our services. Log on and click on Advisor Registration to get more details.
If you are a client or wish to become one, please make an appointment to discuss our investment strategies by calling Connie or Tony at (517) 699-1554, ext 10 or 11. Or e-mail us at tpi@thepracticalinvestor.com .
Anthony M. Cherniawski,
President and CIO
http://www.thepracticalinvestor.com
As a State Registered Investment Advisor, The Practical Investor (TPI) manages private client investment portfolios using a proprietary investment strategy created by Chief Investment Officer Tony Cherniawski. Throughout 2000-01, when many investors felt the pain of double digit market losses, TPI successfully navigated the choppy investment waters, creating a profit for our private investment clients. With a focus on preserving assets and capitalizing on opportunities, TPI clients benefited greatly from the TPI strategies, allowing them to stay on track with their life goals
Disclaimer: The content in this article is written for educational and informational purposes only. There is no offer or recommendation to buy or sell any security and no information contained here should be interpreted or construed as investment advice. Do you own due diligence as the information in this article is the opinion of Anthony M. Cherniawski and subject to change without notice.
Anthony M. Cherniawski Archive |
© 2005-2022 http://www.MarketOracle.co.uk - The Market Oracle is a FREE Daily Financial Markets Analysis & Forecasting online publication.