


U.S. Stock Market Analysis and Forecast
Stock-Markets / Stock Markets 2014 Jul 07, 2014 - 04:28 PM GMTBy: Submissions

 Gary Tanashian writes: The following is an excerpt from NFTRH 298′s 38 pages of hard hitting, no b/s market analysis, which also included extensive work on the precious metals along with commodities, currencies, global markets and market sentiment.
Stock Markets – US
Happy Independence Day America! Your markets are bullish… and over bought, over loved and running on increasing momentum.
Courtesy of SlopeCharts
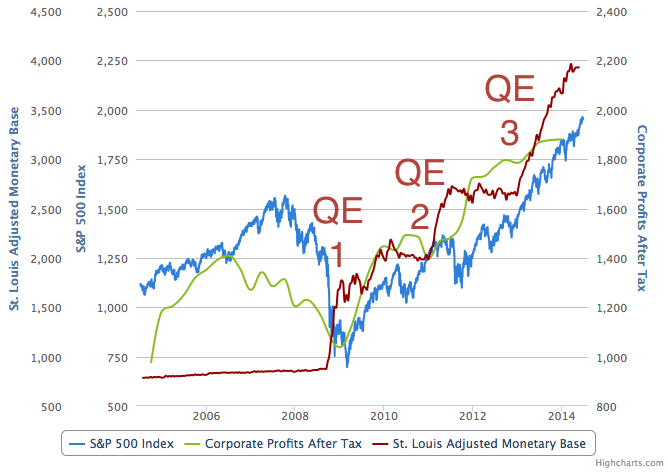
The graph tells a story of the end of the Greenspan era’s commercial credit inflation, which was resolved in 2008, and the beginning of the Bernanke era and official credit inflation, which is ongoing.
1) The bubble in mortgage and high risk commercial products (notice how official monetary base was in essence flat) began to fade in 2006 as corporate profits began to roll over, soon followed by the S&P 500.
2) The 2008 liquidation of the Greenspan era excesses brought with it all manner of official bailout operations, including QE’s 1, 2 & 3. Notice how each QE was instituted after a flattening of money supply.
3) But ultimately it is corporate profits that conventional market analysts are paid to respect (paying no attention to that man behind the policy curtain) and they have generally been strong.
4) As we noted last week, profits are rolling just a bit. Meanwhile money supply and the stock market continue upward. But there is a thing called ‘QE tapering’ in play and that could eventually flatten out the money supply as happened in 2010 and 2011/12.
5) They are tapering in an effort to gently manage an exit from the latest round of market and economic manipulation AKA official inflationary operations.
It will end badly because it was created through manipulation, not productivity. The current operation makes Greenspan look like child’s play. He had plausible deniability because it was the evil entities on Wall Street that took his policy ball and ran with it, slicing and dicing up all sorts of investment vehicles to sell to an unsuspecting public.
This time, there is no middle man. The Fed is more honest about its inflation as it expands its own balance sheet for all to see. And yes, the balance sheet is still expanding albeit at a tapered pace. Add in Zero Interest Rate Policy (ZIRP-Infinity?) and the Bernanke Fed has been celebrated as heroic because the majority perceive that they successfully did what they had to do to save the financial system.
But what the sycophants always seem to forget is that they had to do it because a different flavor of the same inflationary Fed policy fomented bubbles and brought on the big bust to begin with.
We remain in the age of Inflation onDemand and of boom/bust, which is much different from the pap that the happy idiots pumping today’s bullish environment would like to believe. Right now we are on a boom and that should not be denied. But understanding the framework within which the boom exists is important in managing risk.
What look like stellar technicals right now could continue to an upward blow off because that is how booms usually end. But if we are correct on the boom/bust nature of policy driven markets, the bust is gonna be a doozy. So please keep that on radar as well.
These are not conventional markets.
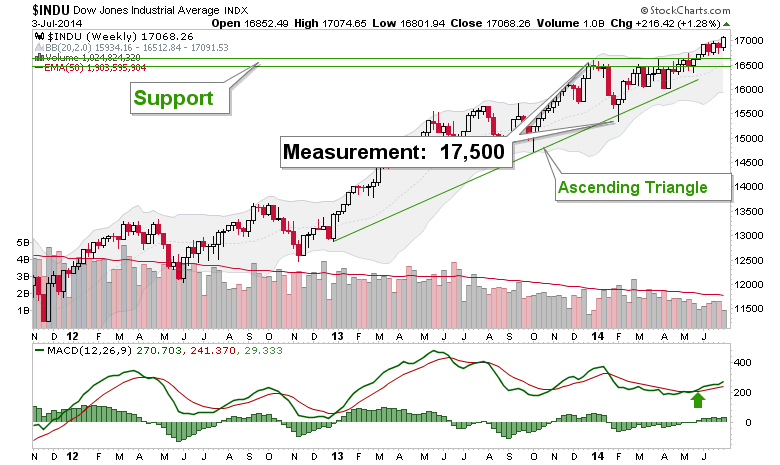
With that said, the Dow continues to target 17,500.
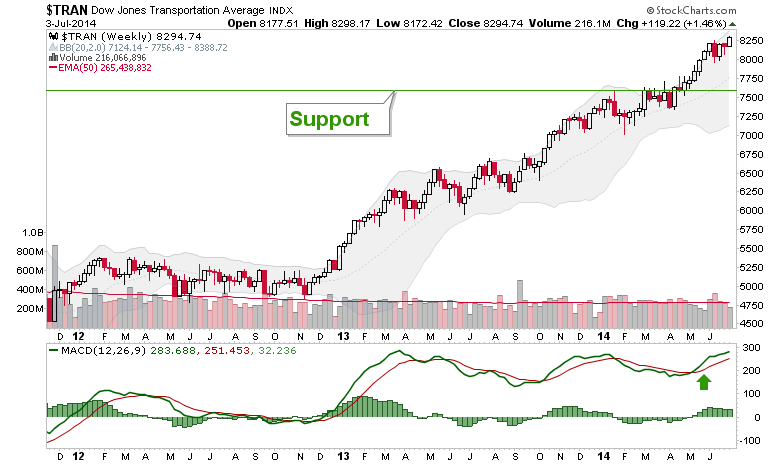
Tranny is in confirmation.
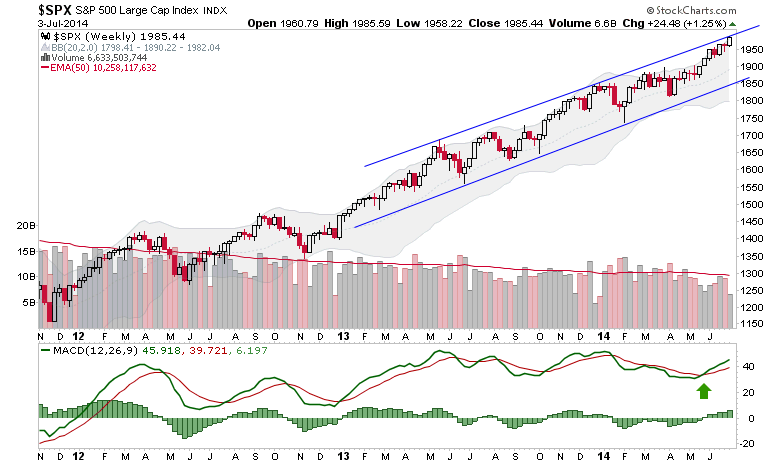
S&P 500 is at the top of the channel and in a strong bull trend. The channel top marks it as a candidate for a normal corrective decline. Alternatively, a break upward out of the channel – a channel buster – would be a sign of a possible building bull climax.
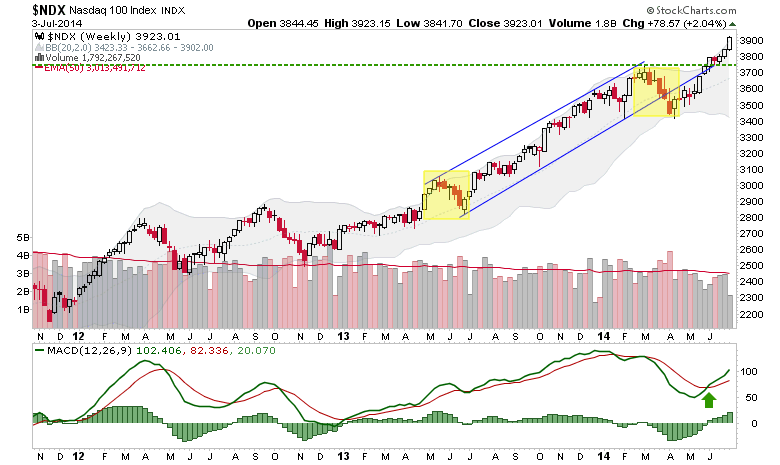
Nasdaq 100 is very strong on post-corrective momentum.
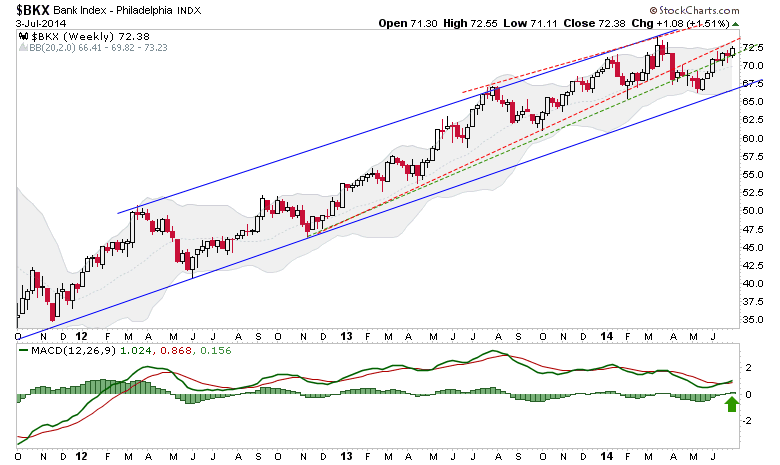
The banks are relatively under performing but are bullish.
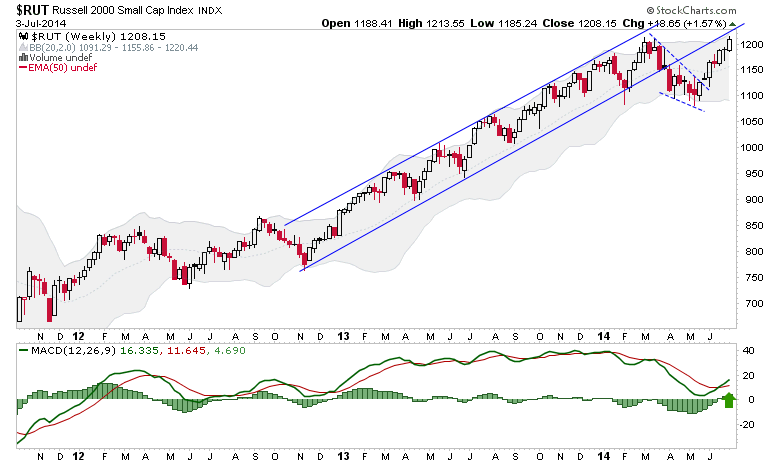
The Small Caps could either lead a market breakdown from the former channel bottom or gain some serious upside momentum. Watch the Small Caps as they are a momentum key and also because the Russell 2000 has a big picture measurement of 1378.
Is the current low relative momentum a negative divergence indicating an oncoming stock market correction (perhaps prior to new highs later in the year?) or is this index refueling to lead a big market mania blow off in a nearer term? Again, watch the Russell.
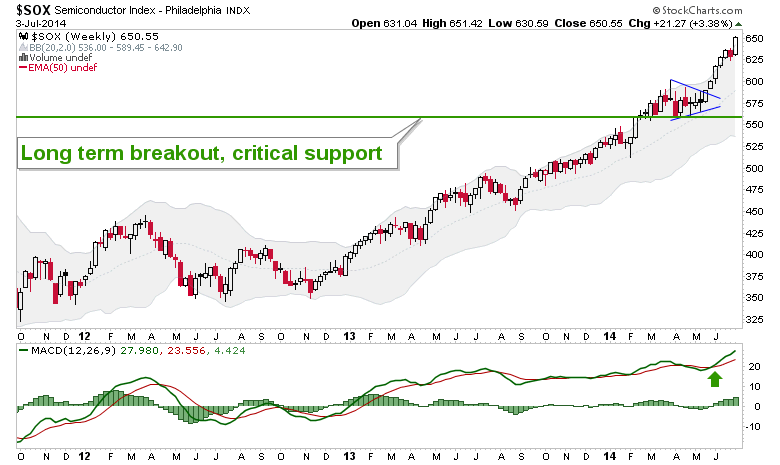
The SOX has long since proven its case as a momentum leader. Yet the reason I do not write the SOX off as a bubble index is because I do not write its biggest component (Intel) off as a bubble stock.
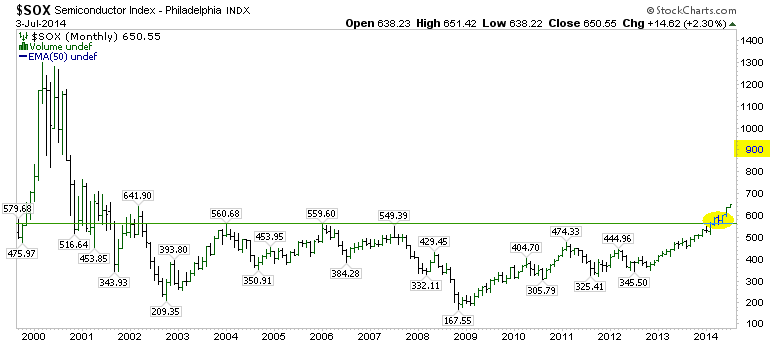
Monthly SOX has a target of 900.
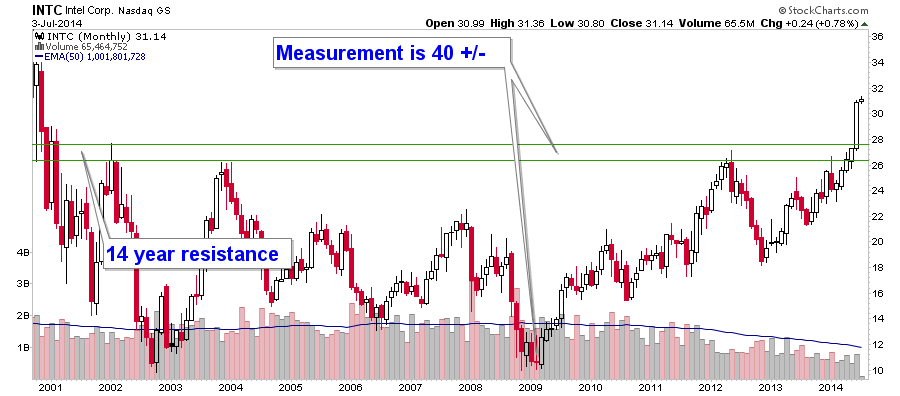
Monthly INTC has a target over 40. The NFTRH+ chart above was created before the break through resistance, now support. I mention this so you will know that I am not simply charting or trend following. I liked Intel for its technical and fundamental potentials. Now a technical potential (long-term resistance break) has become a reality.
The information I had on Intel was to expect big improvements in their mobile chip initiatives, which have been sorely lagging for this chip giant. Instead what happened was that corporate PC demand increased (driving Intel through our projected breakout point) and the mobile chip market is still out there to be better penetrated, at least if Intel has any kind of fundamental execution coming.
Functionally what this does for me however, is to tell me to be careful about getting bearish on the SOX if I am bullish on Intel, the highest weighted component (of the iShares SOXX fund).
By extension it continues to moderate a bearish long-term stance on the stock market just yet, since the SOX has been our leading indication since January of 2013.
So the discussion on page 15 and 16 is in the realm of the theoretical, where I do not believe that a bullish backdrop is sustainable. But everything since page 16 has been bullish and you do not fight the market for what you may think you know is right with money you don’t want to lose, because you probably will lose it.
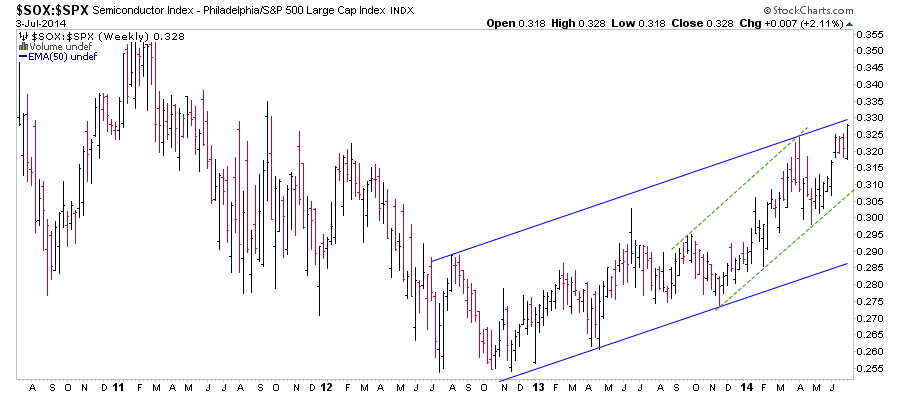
SOX leadership vs. SPX remains intact…
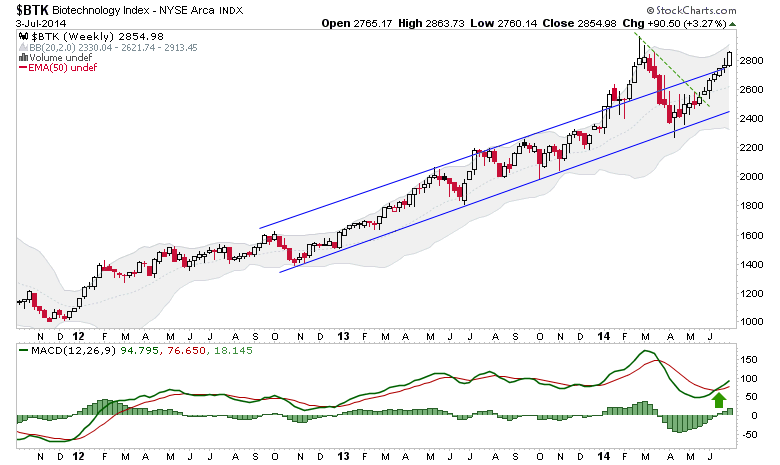
Talk about rebuilding momentum, check out the Biotechs…
Indicators
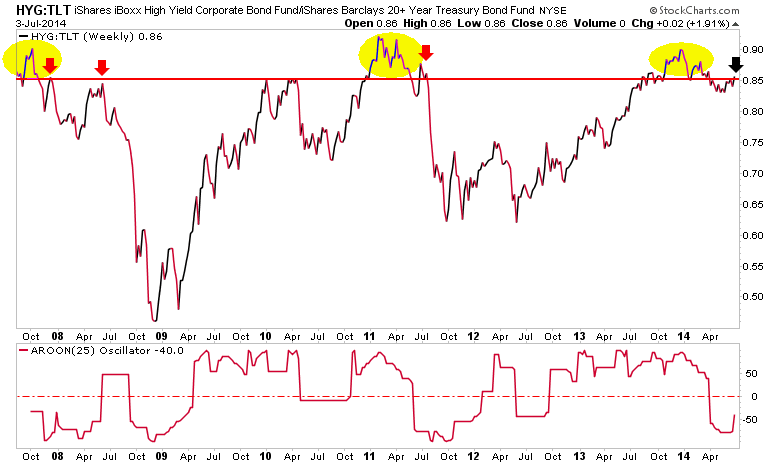
HYG-TLT (a junk vs. ‘quality’ credit spread) turned up last week and is threatening the breakdown line. This could simply be a breakdown retest (like the 3 red arrows) to suck in a few more bulls prior to a market correction. It could also be a gateway to an upside market blow off.
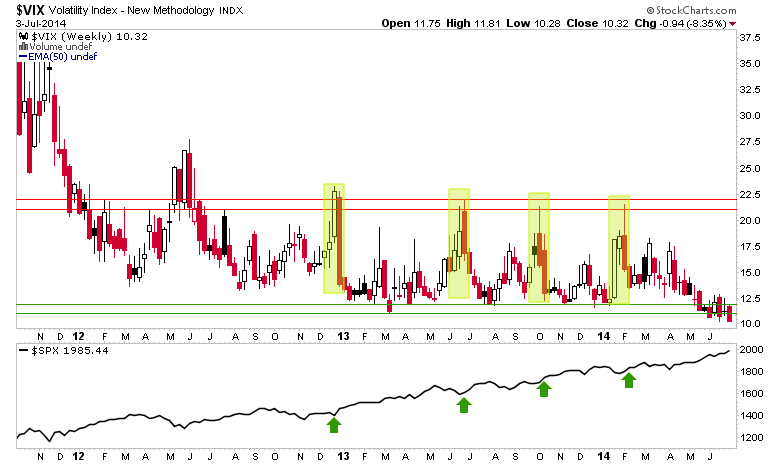
VIX is comatose as market players seem to perceive no volatility problems whatsoever.
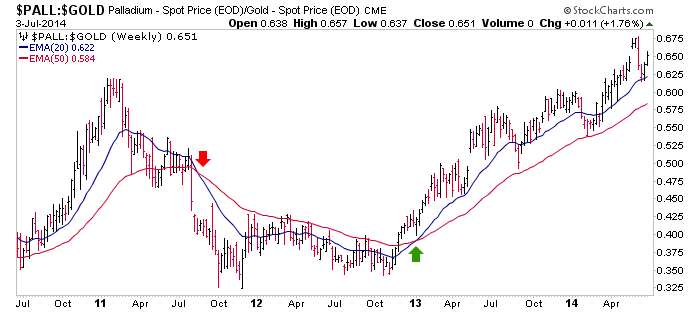
Palladium vs. Gold continues to indicate that all is well. This goes well with recent ISM and other economic data.
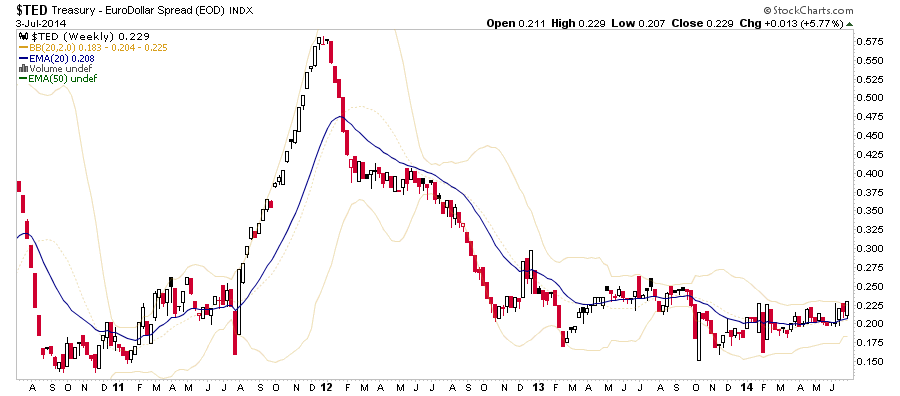
As noted last week we are going to include the TED spread going forward as long as it looks like it could bottom. A potentially bottoming TED does not a risk ‘OFF’ environment make, but if TED turns up building systemic stress would indicated.
Finally, refer to the Gold-Silver ratio on page 12. It too indicates all is well and players are sleeping soundly as summer vacation season kicks in.
The question however, is when will the markets hit a point that is ‘as good as it gets’ in its sleepy bullish state?
The US stock market is quite vulnerable to a correction, which could be healthy in nature; a pause to refresh that might put the ultimate top out to later in the year. If the market does not pause and grind out some of the over bullishness, a top that comes off of unsustainable momentum and over bullishness would probably be terminal.
US Stock Market Bottom Line
Option 1: We stand with the view that a near term correction is probable because sentiment – as you will see below [ed. not included in this excerpt] – is unhealthy, indicators like the VIX and the Gold-Silver ratio are stretched to limits, the market is separating from the fundamentals that even conventional analysts follow and simply because July is a month that usually brings about some disturbances. This is the favored view.
Option 2: The less favored view is that dumb and increasingly greedy money now sponsoring the market continues to pour in taking US stocks to an eventual ‘silver 2011’ style flame out.
Option 1 is potentially much more bullish from a sustainability standpoint.
Option 2 would get all sorts of dumb money excited before likely terminating the bull.
The NFTRH service includes ‘in-week’ market updates (including Key ETF charts) and NFTRH+, a ‘chart trade’ oriented aspect. Most importantly, it comes with a writer who is always accessible to answer any questions that the analysis may present as customer service is THING #1 at NFTRH.
© 2014 Copyright Gary Tanashian - All Rights Reserved
Disclaimer: The above is a matter of opinion provided for general information purposes only and is not intended as investment advice. Information and analysis above are derived from sources and utilising methods believed to be reliable, but we cannot accept responsibility for any losses you may incur as a result of this analysis. Individuals should consult with their personal financial advisors.
© 2005-2022 http://www.MarketOracle.co.uk - The Market Oracle is a FREE Daily Financial Markets Analysis & Forecasting online publication.