


Market Oracle Site Monthly Statistics - Dec 2008
Last Updated :10th Dec 2008
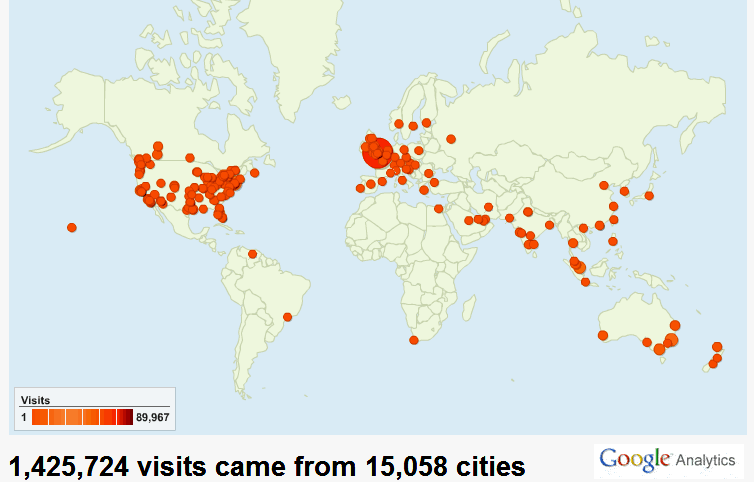
Visitors By Cities (30days)
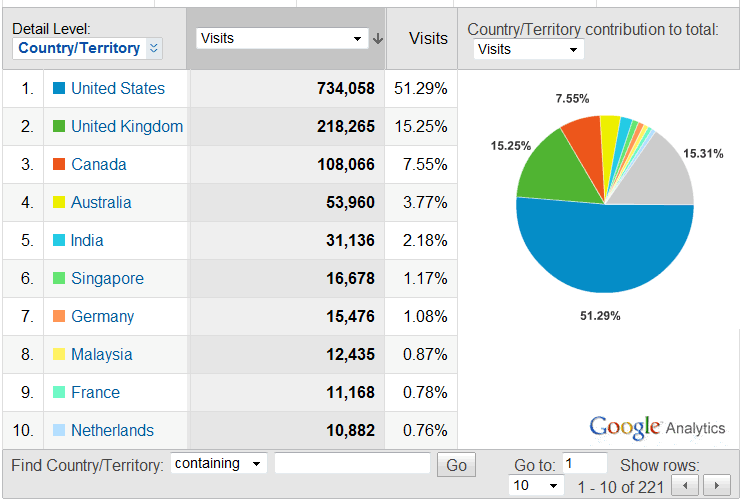
Visitors by Country (%)
If you would like to submit articles to the Market Oracle, then please click here for details.
Top 100 Cities (30 days)
City |
Visits |
|
| 1 |
London |
134372 |
| 2 |
New York |
45598 |
| 3 |
Singapore |
24867 |
| 4 |
Sydney |
23064 |
| 5 |
Melbourne |
16839 |
| 6 |
Los Angeles |
15904 |
| 7 |
(not set) |
15643 |
| 8 |
San Francisco |
11550 |
| 9 |
Manchester |
11170 |
| 10 |
Don Mills |
10754 |
| 11 |
Hong Kong |
10404 |
| 12 |
Chicago |
9583 |
| 13 |
Brisbane |
9420 |
| 14 |
Houston |
9124 |
| 15 |
Vancouver |
8044 |
| 16 |
Calgary |
7931 |
| 17 |
Kuala Lumpur |
7869 |
| 18 |
Birmingham |
7729 |
| 19 |
Washington |
6856 |
| 20 |
Mumbai |
6654 |
| 21 |
Seattle |
6460 |
| 22 |
Dublin |
6297 |
| 23 |
Auckland |
6252 |
| 24 |
Perth |
6233 |
| 25 |
Paris |
5917 |
| 26 |
Denver |
5807 |
| 27 |
Atlanta |
5806 |
| 28 |
Petaling Jaya |
5299 |
| 29 |
Edmonton |
5205 |
| 30 |
Portland |
5186 |
| 31 |
Dallas |
5149 |
| 32 |
Weston |
5007 |
| 33 |
Madrid |
4968 |
| 34 |
San Diego |
4885 |
| 35 |
Bangkok |
4793 |
| 36 |
Minneapolis |
4631 |
| 37 |
Zurich |
4550 |
| 38 |
Ottawa |
4384 |
| 39 |
Delhi |
4210 |
| 40 |
Bristol |
4184 |
| 41 |
Glasgow |
4153 |
| 42 |
Austin |
4123 |
| 43 |
Dubayy |
4088 |
| 44 |
San Jose |
4059 |
| 45 |
Bangalore |
4044 |
| 46 |
Chennai |
3985 |
| 47 |
Phoenix |
3801 |
| 48 |
Sheffield |
3769 |
| 49 |
Philadelphia |
3693 |
| 50 |
Columbus |
3473 |
| 51 |
Honolulu |
3468 |
| 52 |
Amsterdam |
3390 |
| 53 |
Athens |
3382 |
| 54 |
Mont-Royal |
3311 |
| 55 |
Edinburgh |
3233 |
| 56 |
Leeds |
3130 |
| 57 |
Adelaide |
3120 |
| 58 |
St Louis |
3077 |
| 59 |
Las Vegas |
3060 |
| 60 |
Moscow |
2958 |
| 61 |
Seoul |
2941 |
| 62 |
West Hollywood |
2887 |
| 63 |
West Vancouver |
2881 |
| 64 |
Sacramento |
2868 |
| 65 |
Wembley |
2738 |
| 66 |
Shanghai |
2686 |
| 67 |
Miami |
2514 |
| 68 |
Tokyo |
2507 |
| 69 |
Arlington |
2480 |
| 70 |
Sunnyvale |
2454 |
| 71 |
Charlotte |
2436 |
| 72 |
Cambridge |
2402 |
| 73 |
Toronto |
2329 |
| 74 |
Vienna |
2314 |
| 75 |
Southampton |
2251 |
| 76 |
Brussels |
2250 |
| 77 |
Boston |
2248 |
| 78 |
Scottsdale |
2226 |
| 79 |
Indianapolis |
2225 |
| 80 |
San Antonio |
2216 |
| 81 |
Warsaw |
2205 |
| 82 |
Winnipeg |
2204 |
| 83 |
Piedmont |
2200 |
| 84 |
Nashville |
2181 |
| 85 |
Madison |
2170 |
| 86 |
Helsinki |
2161 |
| 87 |
Victoria |
2147 |
| 88 |
Tucson |
2132 |
| 89 |
Istanbul |
2122 |
| 90 |
Plano |
2057 |
| 91 |
Albuquerque |
2056 |
| 92 |
Milan |
2050 |
| 93 |
Munich |
2014 |
| 94 |
Cambridge |
2001 |
| 95 |
Outremont |
1990 |
| 96 |
Riyadh |
1987 |
| 97 |
Orlando |
1963 |
| 98 |
Prague |
1948 |
| 99 |
Bekasi |
1934 |
| 100 |
Bucharest |
1926 |
All Time Statistics
Most Popular Topics

Top 15 Analysis Categories (Out of 160)
