


Weekly Wizards on the Stock and Commodity Markets Next Move
Stock-Markets / Financial Markets 2009 Apr 29, 2009 - 12:20 PM GMTBy: Weekly_Wizards

 Mike Paulenoff, on the Financial and Oil & Gas ETFs
~~~~~~~~~~~~~~~~~~~~~~~~~~~~~~~~~~~~~~~~~~~~~~~~
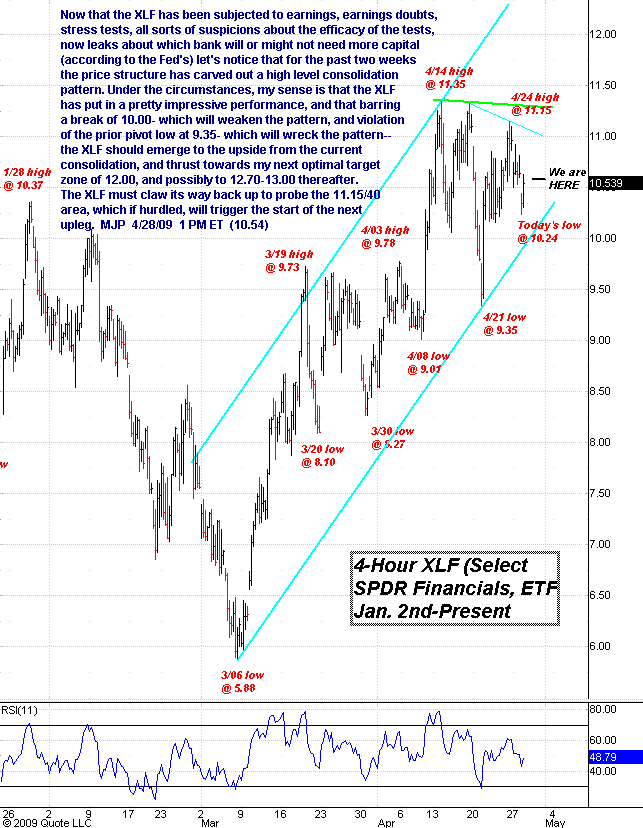
Now that the Financial Select SPDR (XLF) has been subjected to earnings, earnings doubts, stress tests, all sorts of suspicions about the efficacy of the tests, and now leads about which bank will or might not need more capital (according to the Fed), let's notice that for the past two weeks the price pattern has carved out a high level consolidation pattern.
Under the circumstances, my sense is that the XLF has put in a pretty impressive performance and that barring a break of 10.00, which will weaken the pattern, and violation of the pivot low at 9.35, which will wreck the pattern, the XLF should emerge to the upside from the current consolidation and thrust towards my next optimal target zone of 12.00 and possibly to 12.70-13.00 thereafter.
The XLF must claw its way back to probe the 11.15/40 area, which if hurdled will trigger the start of the next upleg.
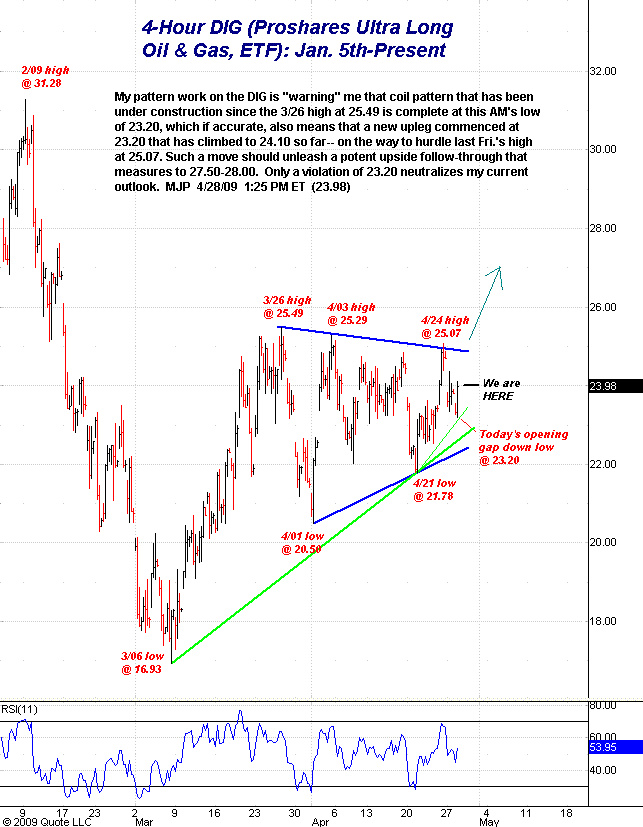
My pattern work on the ProShares Ultra Long Oil & Gas ETF (DIG) is "warning" me that a coil pattern that has been under construction since the March 26 high at 25.49 is complete at Tuesday morning's low of 23.20, which if accurate also means that a new upleg commenced at 23.20 that is climbing towards a hurdle of last Friday's high at 25.07. Such a move should unleash a potent upside follow-through that measures to 27.50-28.00.
Only a violation of 23.20 neutralizes my current outlook.
Mike Paulenoff is author of MPTrader.com, a diary of his intraday chart analysis and trade alerts on the ETFs for gold, oil, equity indices and other sectors. Sign up for Free 15-Day Trial.
Gary Dean, on the Market's Next Move
~~~~~~~~~~~~~~~~~~~~~~~~~~~~~~~~~~~~~~~~~~~~~~~~
Everybody knows what the next direction should be and no new money is coming into the markets. But yet a phantom buyer steps in when the S&P 500 futures are down 16 just before the open and starts buying the heck out of the opening gap lower. This has now happened something like 10 times since March 26, where someone has stepped in to save the decline. Tuesday was hands down the most obvious view of the games that are being played and how unsure/uncertain the boyz painting the tape have with letting the market run on its own. Monday night, almost every major world market closed down on average around 1.5% over concerns of the outbreak of the "swine flu" and what it may do to the future economy if not contained right away. To add to the SPX futures selling pressure were the rumors that Citigroup (C) and Bank of America (BAC) may be forced to raise capital under the stress test guidelines.
Now I understand climbing the "wall of worry," but when new money isn't comfortable jumping into the indexes at these levels, who started the buy program that reversed the Dow from down more than 80 to up more than 50 -- and why? There is no other reason than some powerful people (institutions) do not want to roll the dice on what may happen if the indexes roll over here, as they may have too much on the line.
I have mentioned the imbalance of liquidity in the markets, and the one thing that could crush the puppet masters "Master Plan" would be panic in the markets. It would force them to sell without any buyers underneath (how big moves down happen). They will do everything in their power to hold off that type of tape, but sometimes it is out of their control. So far, they have done a fantastic job of stopping it in its tracks and we have to respect that for now.
However, sellers are waiting to unload as the puppet masters use a ton of energy propping up the tape. With a ton of money on the sidelines, most not believing the rally and not willing to step in at these levels, the new money needed for the puppet masters to unwind their positions won't be there. (Short covering won't be enough for them to unwind.) This is what has them very uneasy. They need to convince the new money to come in now, especially with the uncertainty coming into the markets.
A move above 875 would cause the next short covering, but unfortunately, the top would come somewhere around the 881-890 area. Each short covering rally that they have force-fed the markets has come with shallow breakouts. And they haven't lasted very long once the shorts are finished covering. Are you starting to see the dilemma they are running into here? They are using more and more capital to cause breakouts that are shrinking and continue to keep new money out of the markets.
Why are we fighting the trend, has been the question I have read over and over again. So my response would be this, WHAT TREND? The Dow made its high on April 17, just 3% higher than the highs set on March 26. At today's lows, the Dow was at the EXACT same place as the highs set on March 26. So if you missed the initial long side trade at 6470 (which 99% of the financial web sites and retail traders did) and jumped in 2+ weeks later (March 26) you are up 1+%. So again, I ask, what TREND is everyone talking about?
With the daily technical's screaming warnings of a deep pullback, why should anyone doubt 10 gap downs since March 26 and some being fairly large? There were short term indicators calling for bounces, but in a typical market environment, the longer-term technicals overpower the shorter-term technicals. That hasn't been the case as of lately and why this tape has been so hard to manage. But even fighting the manipulating of the tape, we are still +15.90% ytd in our closed portfolio.
Gary Dean is author of MarketsPath.com, a real-time journal of his trade alerts on the ProShares Ultra Index ETFs. Sign up for a Free 30-Day Trial.
Harry Boxer on his Chart of the Day: Converted Organics (COIN)
~~~~~~~~~~~~~~~~~~~~~~~~~~~~~~~~~~~~~~~~~~~~~~~~
Today I'm going to talk about a low-priced stock, Converted Organics (COIN), that I normally don't discuss, but it's a former favorite of ours that several of our subscribers have inquired about and had a technically significant day today. The intraday chart today was spectacular in that it opened positive, worked its way higher from the mini flag, had several little pennants and then a longer 2-hour coil with a low-volume ebb just before it broke out again. The stock rose from 82 cents to 1.36, reaching 1.42 in the aftermarket, up 71% on 6.3 millon, the heaviest volume in more than a year.
The downtrend channel that's been in force technically has not been broken and neither has lateral resistance. But the thrust on heavy volume and in the technicals was impressive enough to move across the 40 and 21 day moving averages and close right at the multi-month declining tops line and lateral resistance from the March highs.
Any move across the 1.45-.50 zone could see a quick move to 2-2.20. Beyond that the secondary target is in the 3.35-.50 zone, so potentially close to a triple over the course of the next few weeks if this one carries through and breaks through this key area of resistance where it closed at today.
We first spotted the stock in the 3-4 range before it went to the 17 area. So COIN has a history of higher prices, and could easily get back to the 3-3 1/2 zone over the course of the next few weeks. So definitely worth watching.
See Harry's video chart analysis on COIN.
Harry Boxer is author of The Technical Trader, a real-time diary of his market insights and day, swing & intermediate-term trading ideas. Sign up for a Free 15-Day Trial.
Jack Steiman, on S&P 500 Levels to Watch
~~~~~~~~~~~~~~~~~~~~~~~~~~~~~~~~~~~~~~~~~~~~~~~~
The market has made it clear for now that the combination of 20 day at 839 SPX and gap at 853 are acting in concert to hold the bears off. The bears are using 875 to hold off the bulls. We are trading in between that range and yes, it is quite boring but it can be positive for the short- to medium-term. The trading sideways will allow for overbought conditions to unwind themselves and that's what the market needs. If price collapses with that unwinding that would obviously be bearish. With the market moving laterally in that process it offers up hope that 875 can be taken out before we break down, but there is no way to say that's a guarantee by any means.
I don't think, however, that we're in a new bull market. There is real danger in this market being long even though that's where we are with model portfolio positions like Union Pacific (UNP) and Illumina (ILMN). We feel that the market is likely to have just one last move left in it before it tops. But buying long term here we think would be a big mistake. This is a trading market, and this bear will test us again. I think we can possibly see 900-925 SPX in the near term if we take out 875 as I suspect we will. Higher is always a possibility, but getting aggressive above 875 doesn't make too much sense either. Keep it under control.
Jack Steiman is author of SwingTradeOnline, a journal of his market analysis and stock trading alerts. Sign up for a Free 30-Day Trial.
http://www.advicetrade.com/Wizards
© 2002-2009 MPTrader.com, Weekly Wizards an AdviceTrade publication. All rights reserved. Any publication, distribution, retransmission or reproduction of information or data contained on this Web site without written consent from MPTrader is prohibited. See our disclaimer.
Weekly Wizards Archive |
© 2005-2022 http://www.MarketOracle.co.uk - The Market Oracle is a FREE Daily Financial Markets Analysis & Forecasting online publication.