


Stock Market Presidential Election Cycle Seasonal Trend Analysis
Stock-Markets / Stock Markets 2024 Apr 03, 2024 - 11:15 PM GMTBy: Nadeem_Walayat

How are you enjoying AI tech stocks gravy train bull market of 2024?
This is my latest instalment of my in-depth analysis and and concluding S&P detailed trend forecast for 2024 - S&P Stock Market Analysis, Detailed Trend Forecast Jan to Dec 2024 that was first been made available to patrons who support my work.
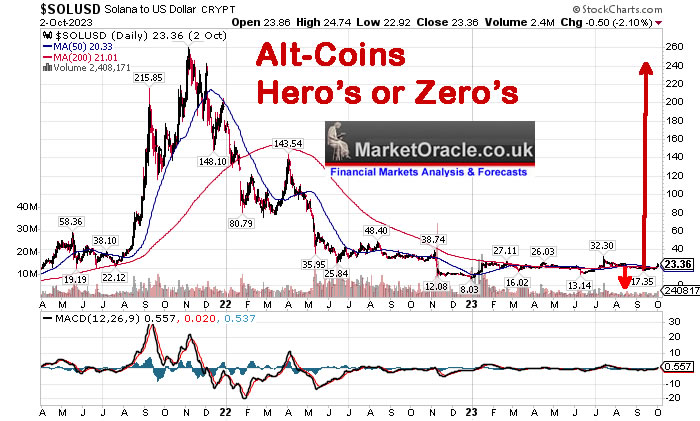
If not stocks then what of the crypto's bull market where one could have would have SHOULD HAVE bought the likes of Solana for $20 which the other day touched $200 and likely to x2 once more before the crypto party is over.
So for immediate first access to ALL of my analysis and trend forecasts then do consider becoming a Patron by supporting my work for just $5 per month, this is your last chance to lock it in now at $5 before it soon rises to $7 per month for new sign-ups. https://www.patreon.com/Nadeem_Walayat.
Contents
US Recession Already Happened in 2022!
US Presidential Election Cycle and Recessions
Margin Debt
Stock Market Breadth
Stock Market Investor Sentiment
Bitcoin S&P Pattern
SP Long-term Trend Analysis
Dow Annual Percent Change
Stock Market Volatility (VIX)
S&P SEASONAL ANALYSIS
Correlating Seasonal Swings
Presidential Election Cycle Seasonal
Best Time of Year to Invest in Stocks
US Recession Already Happened in 2022!
Yes it is a a big fat con because the US has already posted 2 quarters of negative GDP in 2022 Q1 and Q2 , what can you do? This is the world we inhabit of fake economic data, the Fed does not like CPI, lets run with the much lower PCE, 5% instead of 8% inflation! What a con!
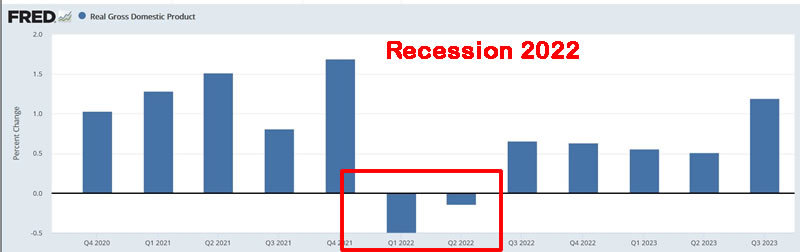
The facts are the US had a recession in 2022 that everyone is ignoring! The US posted Q1 -0.5% and Q2 -0.15%, a recesison in 2022!
US Presidential Election Cycle and Recessions
This analysis posted in January 2023 that despite MSM hysteria strongly suggested that there would be NO recession during 2023, as there had never been a recession during a pre-election year. Whilst the highest risk is that the recession materialises during 2025, though both 2024 and 2026 are equally high recession risk years.
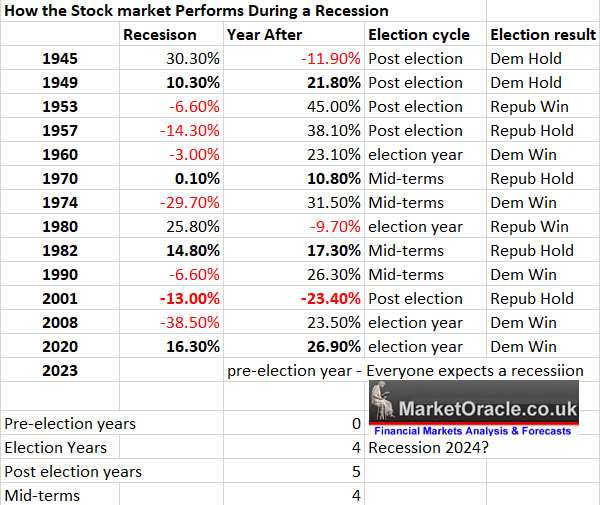
However as my above analysis states the recession already happened during 2022 (mid-terms)! It's madness that the econofools are ignoring that which is staring them in the face! Both the recession AND the bear market have already happened! Which lowers the probability for a recession during 2024 though that does not mean there won't be some sort of economic weakness during 2024 after all rates have rocketed higher which will depress economic activity resulting rate cuts.
So following what the table is saying, some sort of weakening in the economy during 2024 that resolves in a probable recession during 2025, which will become much clearer at the time of next years analysis.
In terms of the stock market, this suggests not to expect a repeat of 2023's 24% advance, more likely is half that advance so maybe 5300 by year end as possible.
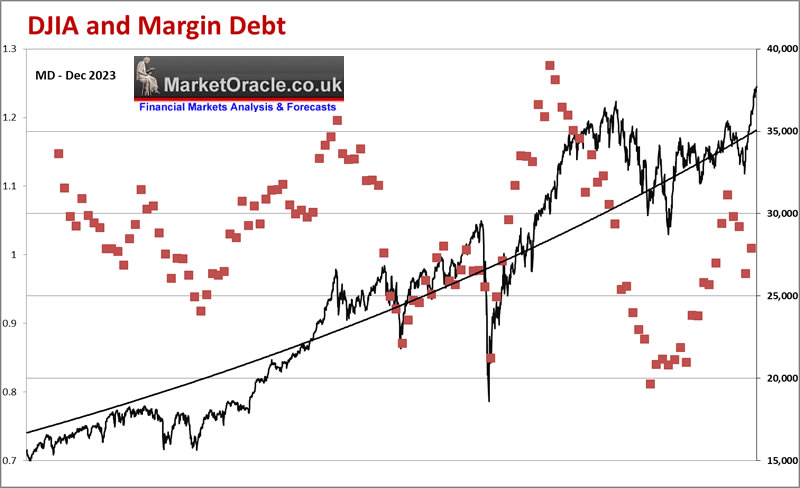
Margin Debt
Margin debt tends to peak and fall long before the stock market turns lower as basically speculators start to feel the pain of holding losing positions and thus cut back on their bets. Either that or are forced to close their losing trades due to failure to meet margin calls, in which respect this indicator proved very useful in flagging the prospects for a bear market long before it materialised as stock prices trended higher on petrol fumes as the fuel tank was empty.
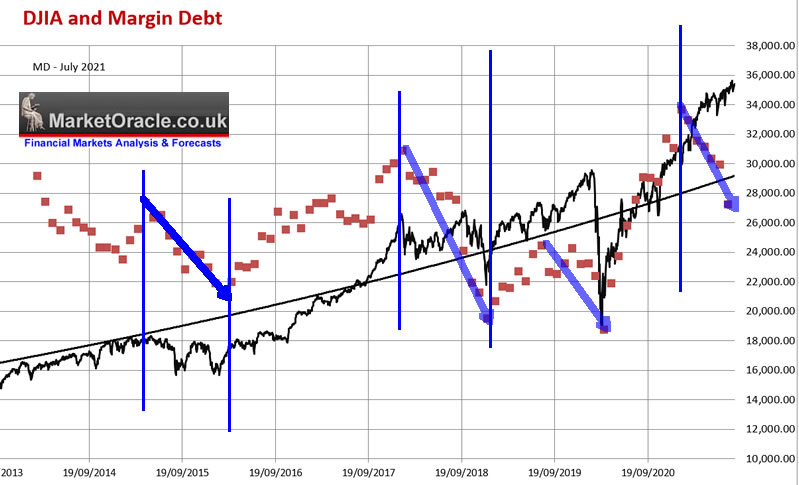
All those who were still waiting for capitulation were looking for it in the wrong place, here's capitulation! Margin debt collapsed to rock bottom as burned investors were kicked out of their FOMO / Buy the dip leveraged positions!
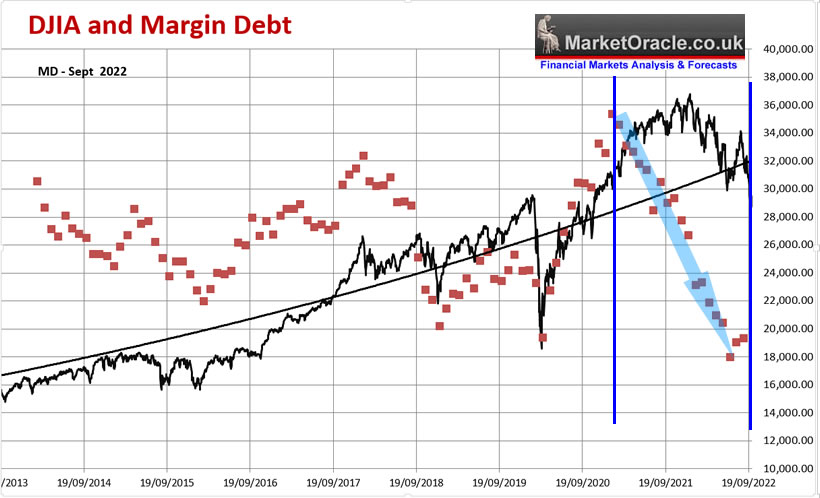
Latest margin debt data shows lack of FOMO, the time to get worried will be when margin debt exceeds the previous highs which will be a sign of rampant FOMO and that a top of sorts is near, a state that we are nowhere near, current levels are supportive of a sustainable bull market.
HEED MY WARNING - NEVER INVEST ON LEVERAGE! As one CANNOT INVEST AND FORGET WHEN USING LEVERAGE! Temporary draw downs WILL Kick you out of your positions, look at COINBASE stock price where all one could know is that it follows the bitcoin price, if bitcoin makes new all time highs then so should coinbase. However there is no way you could have ridden this bronco billy stock down to it's $30 low and then back up to $185 if you were investing using any form of leverage. Same with most stocks, look at Nvidia trading down to about $108! Even if one bought at $190 they would still have been kicked out of their position if they used leverage.
DO NOT FALL FOR THE LEVERAGE TRAP as most Noob Investors do, and it is even crazier in the crypto world where unregulated platforms offer X100 leverage, they do that because they know the fools using leverage will lose all of their money thus easy pickings for the platforms.
Stock Market Breadth
Cumulative NYSE Advancing / Declining issues proved a useful early warning indicator going into the stock 2021 market top, since which closely tracked the markets decline into the bear market bottom, flashing relative strength during the bull market, the only false signal was the sell off into late October. Presently is showing divergence to the S&P i.e. suggesting a downtrend is imminent.
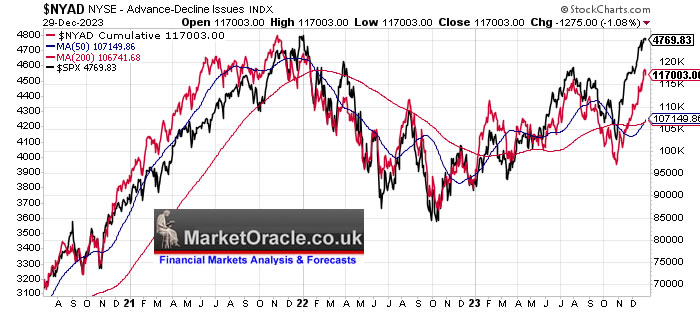
(Charts courtesy of stockcharts.com)
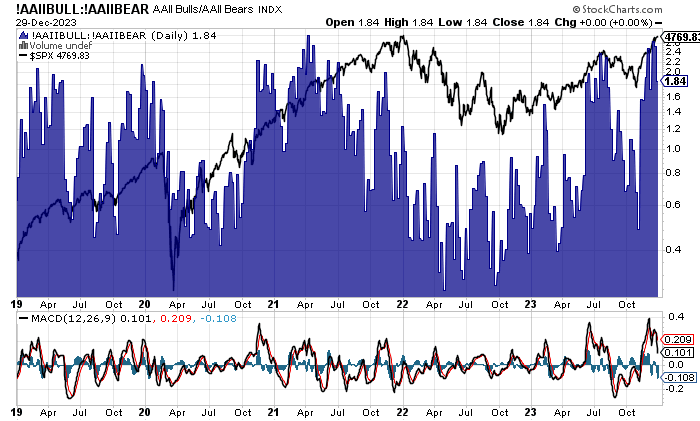
Stock Market Investor Sentiment
TD Ameritrades retail investors sentiment chart illustrates this fact, retail investors have been SELLING since the July high, which followed fairly feeble accumulation, convinced by the cartoon network's mantra that a recession is coming.... Just look at the chart, there is NO FOMO! The S&P is on the verge of breaking to a new all time high and most investors are sat on the sidelines waiting for their fantasy S&P 3200 to materialise! This SHOWS you where you would also be if you had followed the herd during 2023! Another reminder - DO NOT PAY ANY ATTENTION TO MSM which is populated by clueless journalists and fund managers (sales people).
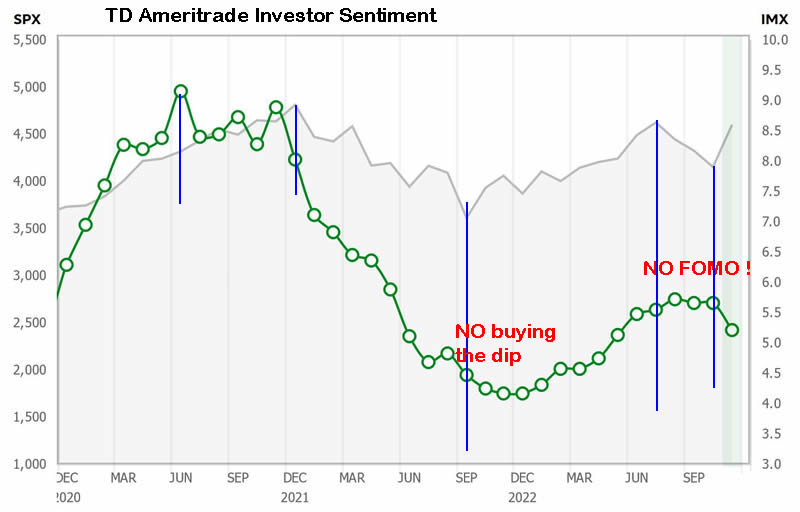
In terms of immediate trend, then the stock market is at an extreme reading on the AAII survey. which means a top of sorts is very near! The problem is that January is an important month in determining the outlook for the rest of the year so January could prove very volatile.
Bitcoin S&P Pattern
Here's a log chart of the Bitcoin price and S&P where I broken the bitcoin trend down into main bull and bear markets, which so far have been followed by minor bull and bear markets.
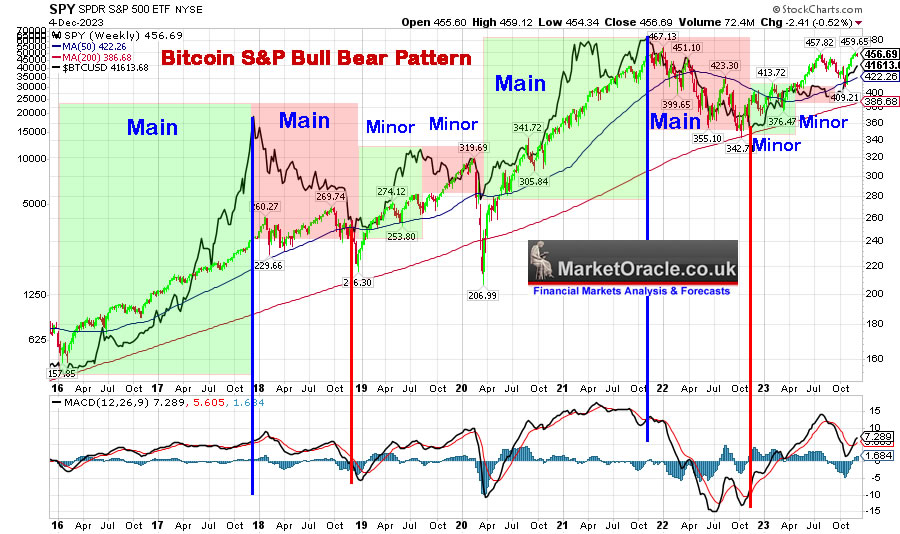
Firstly the chart clearly suggests we are in the early stages of a Major Bitcoin bull market, i.e. following a minor bull and bear follows a Major Bull and then Bear.
The last two Major bull markets were 21 and 18 months in length, thus taking the minor bear bottom as of Mid Sept 2023, then the Bitcoin bull market targets a run to between March and May 2025, as a rough guide of what to expect. So this price pattern is contrary to the ones the crypto maniacs expect which is centered around the halving event in April 2024, i.e. they expect Bitcoin to follow the pattern as in previous cycles which is for a significant drop in price around the halving event, in fact many of the bitcoin models put forward point to the bitcoin bull market proper only beginning 6 months AFTER the halving event i.e. October 2024. Whereas given that the Bitcoin price has breached the minor high of 32k now implies that we are in THE Major bull market and not in a years time. Though it is possible to have significant corrections within a Major bull market as 2021 illustrates that put in a second higher top that confused most at the time.
So my view is that the crypto bull market is going to be compressed in terms of time, I suspect this bull market will fall well short of the 2 preceding bull markets i.e. top out before March to May 2025, where my best guess is to look for a top between September and October 2024, i.e. an INVERSION of the pattern expected by most, where instead of the beginning of the bull market we actually see it top out, a lot of people are going to get caught out once more, just as they were during that second top during 2021, when many had convinced themselves that Bitcoin was heading for $100k and were in denial for the next 6 months, failing to sell, and buying the early stages of the bear market on expectations that the bull would soon resume, which it obviously did not!
The bottom line there is no deviation against my original trend forecast. So as far as I can tell most crypto analysts will remain in denial due to halving event tunnel vision, the bull market they expect to begin in a years time started in September 2023, which thus implies to expect a year long MAJOR BULL MARKET which means most will be waiting for that magic correction to BUY, down to say $30k? $25k? even $20k! All whilst the bitcoin price marches higher, YES it's going to be volatile, after all this is BITCOIN! And so if we do get BIG DIPS I will probably add some more, especially within tax free wrappers i.e. buy some more MSTR.
S&P500 Stock Market Technical Trend Analysis
SP Long-term Trend Analysis
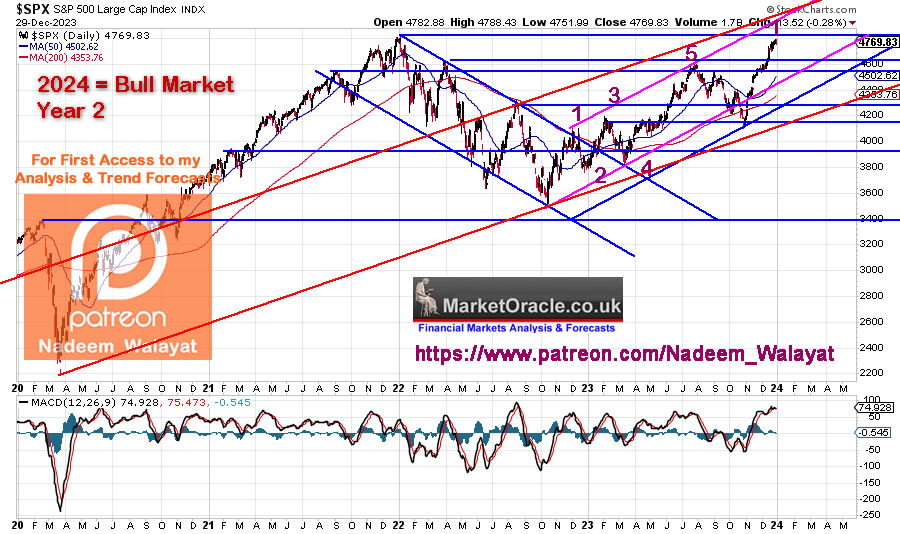
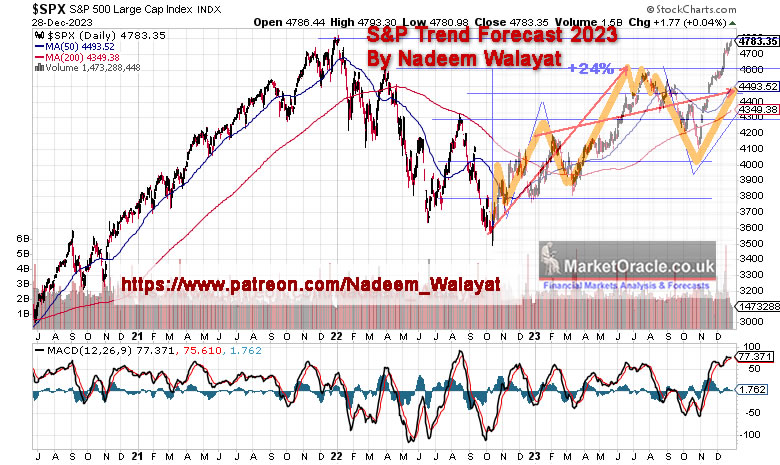
The S&P fulfilled my primary target for 2023 of 4600+, the end of year rally that came within touching distance of setting a new all time high (4820) was all bonus, froth, that will likely hold the market back for the first half of the year i.e. whilst the bull market will soon set a new all time high, it is going to find the first 6 months of the year tough to climb much higher and thus primed for some decent sized corrections, though which will not be deep enough for all those who have been sat on the sidelines i.e. swings higher that result in corrections that fail to fall enough to get those waiting to press the BUY buttons.
(Charts courtesy of stockcharts.com)
TREND CHANNELS - We have 2 main rising trend channels for 2024 identified in red and pink. I suspect the S&P will remain in the pink channel for most of the year, with the red channel containing any false breaks lower or higher.
TREND ANALYSIS - This market has been easy to stay invested in, a case of higher highs and lows all the way, with he added bonus being the corrections were of enough of a magnitude to allow one to distribute and accumulate into. I suspect 2024 will not be so easy at least for the first 6 months of the year, i.e. those sat on the side lines will find it hard to get on board. The market is going to have to fight it's way higher to break each milestone such as 4900, 5000 etc... Until after the election when FOMO kicks in driving stocks to the moon. S&P on trend basis targets 5200 by year end. Where I imagine we will see a repeat of 2023's higher highs and lows which will prevent many waiting for the previous lows to be revisited so as to climb on board.
RESISTANCE - Resistance is at the last all time high of 4820, beyond that will be the round numbers of 5000, 5100, 5200, 5300 and even 5400 which I suspect will be a tough nut to crack.
SUPPORT - At 4600 and then 4200, I doubt we will see 4200 again any time soon.
MACD - MACD is clearly overbought so the current rally is living in borrowed time, there's not much in it beyond setting a new all time high, i.e. I doubt it will reach anywhere near 5000 before resolving in a correction.
ELLIOTT WAVES
As expected August 2023 terminated in a simple 5 wave advance followed by a simple ABC correction. EWavers get too attached to their theory, KEEP IT SIMPLE! You are over complicating things, talking yourselves into gobbledygook! SIMPLE!
I expect the same simple pattern for 2024, where we kick off with a strong Wave 1, so Wave 2 and 3 should be relatively mild, thus the next Wave 1 towards the end of 2024 will likely deliver the meat and potatoes gain for 2024.
The alternative count is...... there is no alternative count, that's for losers who hedge their bets.
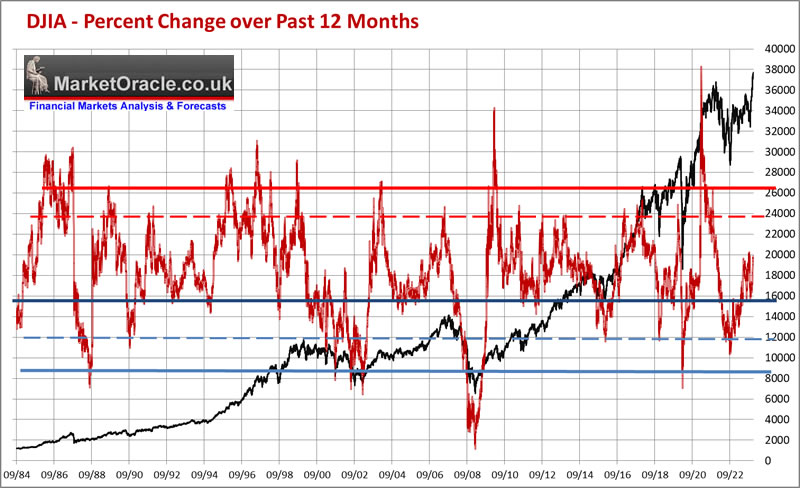
Dow Annual Percent Change
The 2022 Dow Annual Percent Change chart which accurately warned to expect the Dow to drop to 28k during 2022 in 2021 and that the Dow was cheap October 2022.
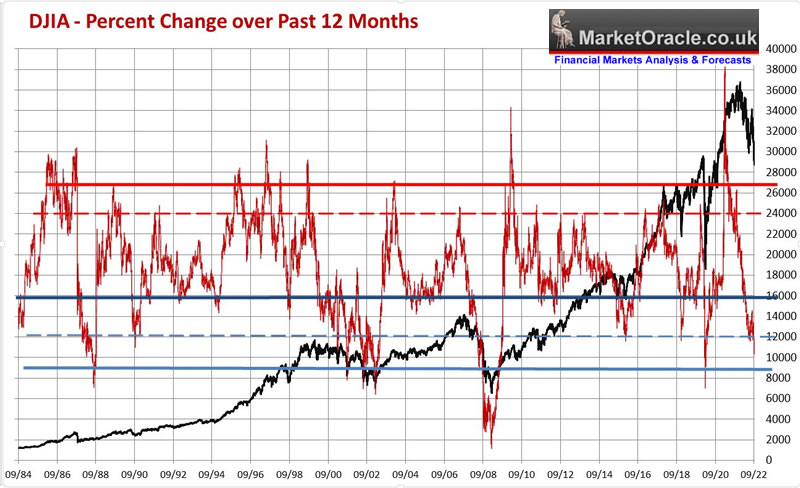
The updated chart shows that the Dow despite trading at a new all time high has not reached a level when one should prepare for severe draw downs.
In my continuing trend to switch from Dow to S&P analysis here is the percent change over 1 to 5 years chart which shows when the S&P is in FOMO mode and how strength ebbs away from the stock market as the smart money distributes into the rally.It also illustrates how bear market bottoms tend to be severe events, the great irony is that many fools had talked themselves into waiting for a capitulation moment before buying during October 2022, that great final sell off down to S&P 3200 and lower, when capitulation was staring them in the face! I think the problem is that all were staring at the March 2020 panic sell off which was abnormal, Instead what we got was a normal capitulation event.
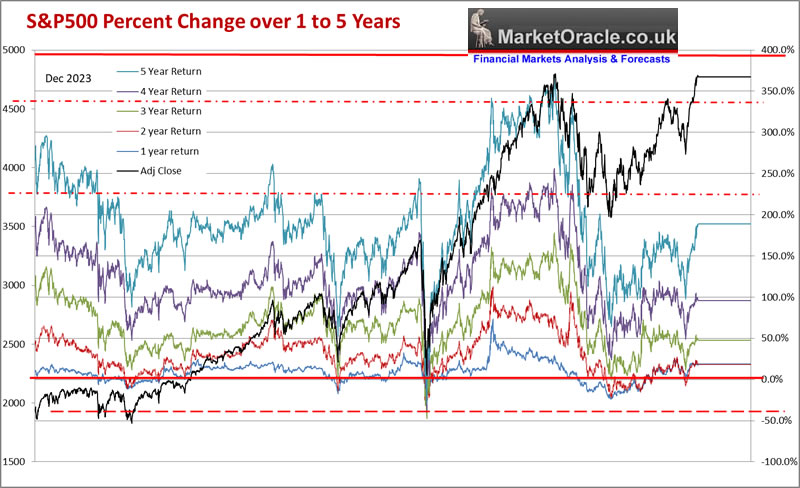
The 1 year is ok, 2 year is ok, 3 year is ok, 4 year is ok, 5 years looks the most expensive of all the years but still less than 50% of where it was at 2 years ago, so is ok.
In terms trend expectations, we have hade the meat and potatoes golden first year run of a new bull market rocketing higher all whilst most have been sat in t-bills and money market accounts. The market is not going to repeat 2023 in 2024,at best we will probably see HALF the advance of 2023, i.e. about 13%, which is still pretty good for a crappy index that most should be able to easily beat if they do not pay attention to the clowns on the cartoon network (CNBC), So 2024 looks set to see a more measured advanced in terms of percentage gain but remember that 13% is off of 4800 rather that 3800 a year ago, so equates to 625 vs 500 points of what it would be off of 3800, the magic of compounding!
Stock Market Volatility (VIX)
One of the reasons why so many have missed the bull market boat during 2023 is because they focused on the likes of the VIX whilst starting in the rear view mirror at 2022 completely flummoxed as to why the stock market is not having a spike in the vix so they can buy. What they failed to understand is that volatility is LOWER during bull markets, so no the vix was unlikely to spike to levels they were all waiting for.
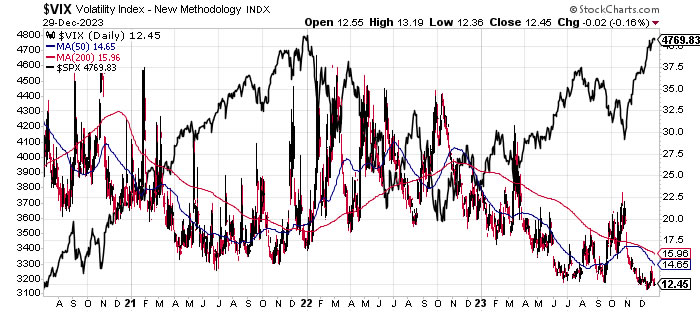
As I often state, tools work until they don't work, for instance I did not use the VIX at ALL during 2023. Did not even look at it, not even during October, because I understood it was irrelevant. And I doubt I am going to see anything useful in the VIX during 2024, it is a red herring, a fools gold indicator.
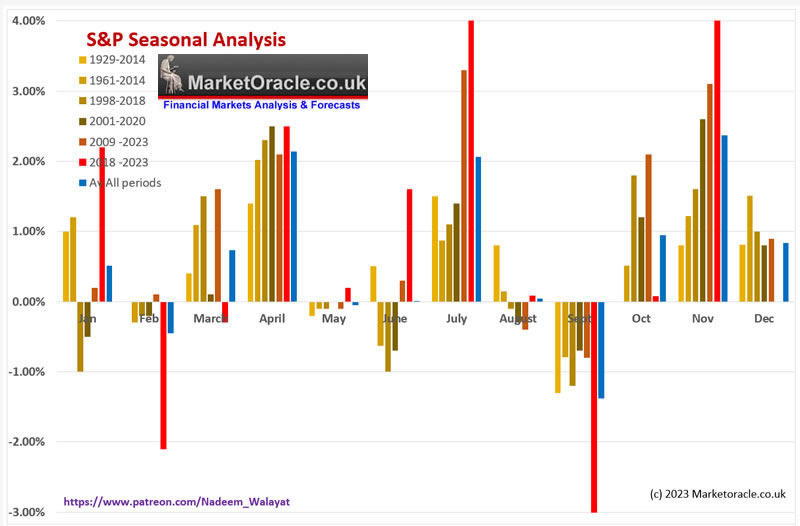
S&P SEASONAL ANALYSIS
The seasonal pattern suggests after a pause in Feb, higher into late April, then correct from early May into late June followed by a brief rally into late July /. Early August before a deep correction into Mid October, resolving in a sharp reversal to end October higher, which would set the scene for a bull run into the end of the year.
Correlating Seasonal Swings
Not satisfied with just seasonal swings I've continued to evolve my near term seasonal swings analysis by comparing the year on year change of the past 5 years which resolves in the following recency bias pattern. Which is very similar to the above monthly seasonal analysis and only really differs to last years analysis in terms of the correction during May and June.
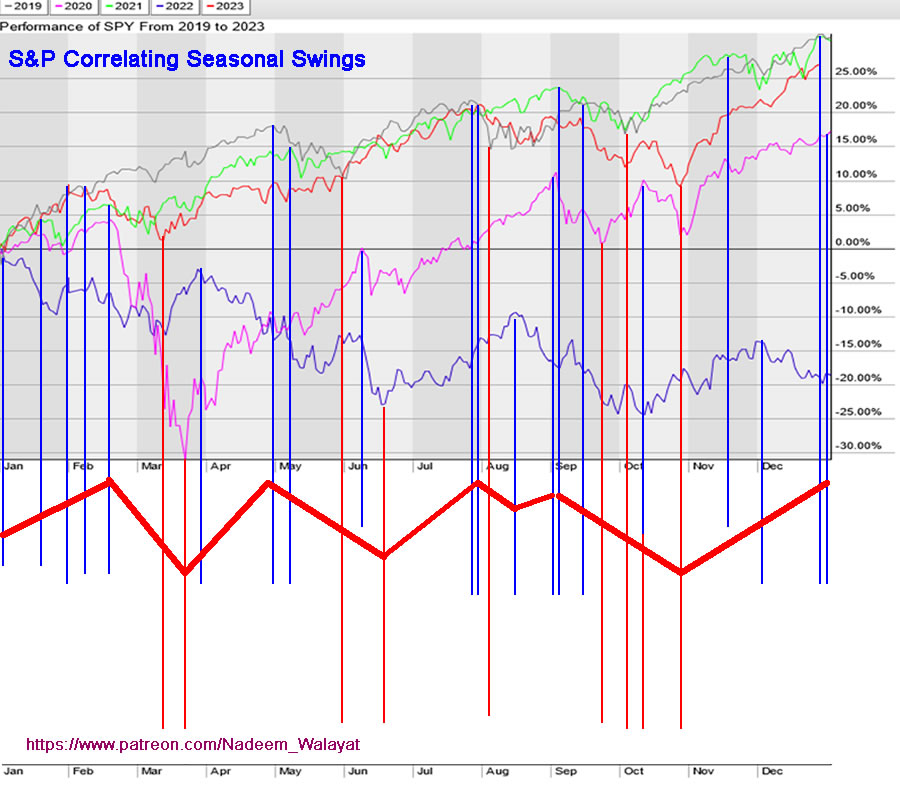
The seasonal swings pattern suggests a rally into early Feb, Down into Mid March, Rally into late April, Down into Mid June, Up into late July followed by a deep correction into late October before a strong post election relief rally.
Presidential Election Cycle Seasonal
During 2023 it seemed like everyone woke up to the importance of the US presidential election cycle.
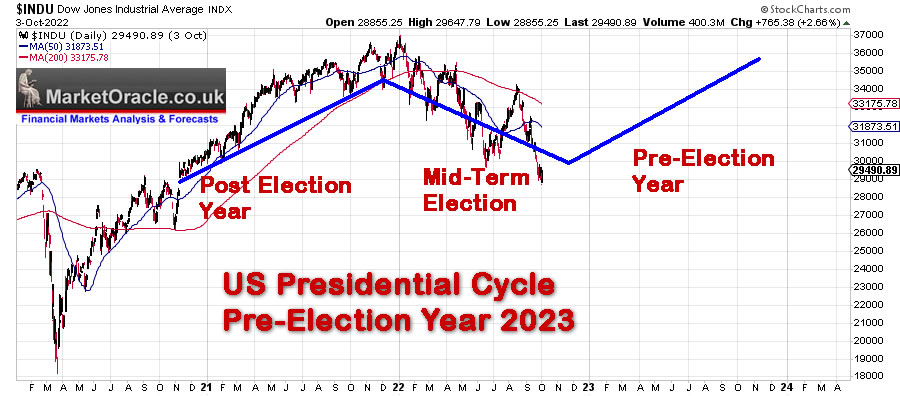
So how did 2023 pan out relative to the Presidential Election cycle?
In terms of month by month we got 8 hits, 3 misses and 1 draw so a 66% hit rate, similar to the all years seasonal pattern where the real value is when one puts both together..
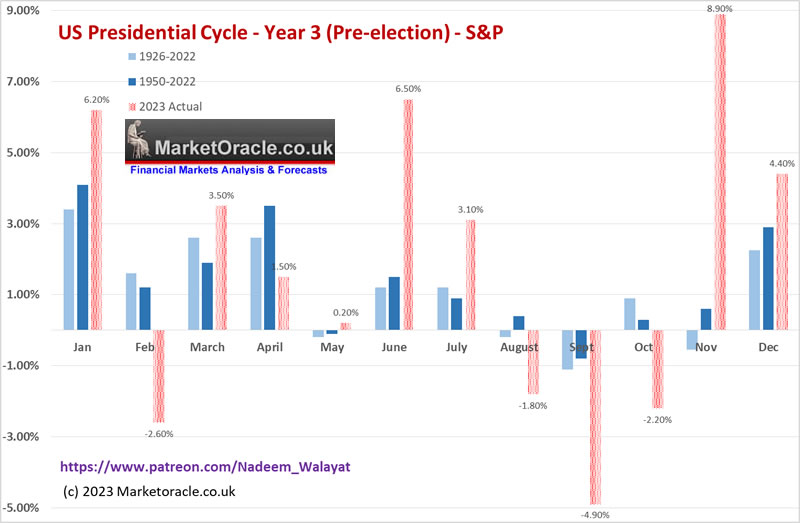
The odds strongly favour a strong year for election years that have an 85% hit rate and average return of 11%. So we should see a return of at least 10% during 2024 i.e. 5247, so it's no wonder that most analysts including Tom Lee are gravitating towards a target of 5200 for 2024 which is called playing it safe!
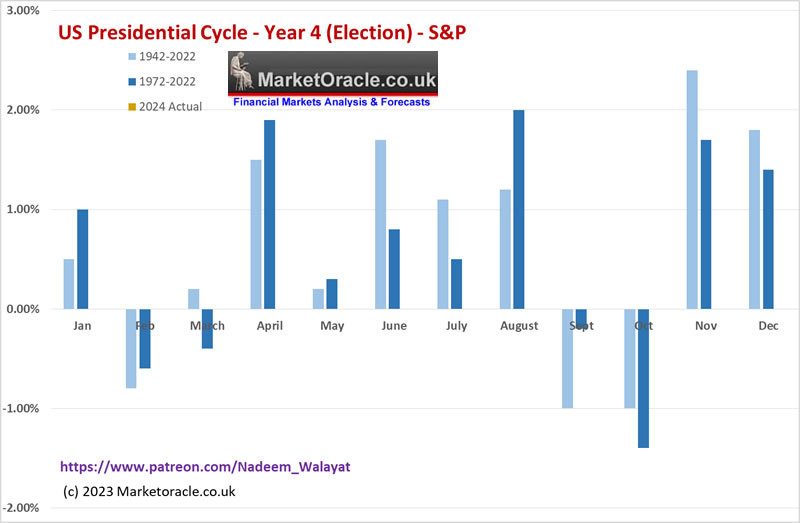
The monthly seasonal pattern for election years suggests a Top in Jan,, Down into March, Strong rally into April, Down into May, up into August, Down into October and a strong bull run into the end of the year.
Whilst an incumbent running results in an even stronger stock market than the election year average unless there is a problem with the incumbent i.e. ill health that results in a NEGATIVE YEAR due to the chaos that ensures during an election campaign. So all eyes on Biden's health as it could turn a +12% year into a -5% year!
Best Time of Year to Invest in Stocks
Statistically the best time of year to buy Stocks is during late October and then hold all the way through to the end of April, for an early May top, whilst the subsequent 6 months tend to be the weakest of the year. What happened this year ?
Late October 2022 to Early May 2023 yielded +14.5%, Next 6 months to late October resulted in -2% WOW perfect hit, all without the benefit of hindsight as I wrote the above in early October 2022 as per my 2022 analysis. But why stick with stock market folklore why not 9 months from late October to late July? WOW that's a 26% gain! Followed by an 11% DIP! That's a collective 37% vs 16.5%, yes it required a lot more effort but for that one gets over twice the return.
What about the current 6/9 month cycle? The S&P at 4770 is already up 16% on where it was late October 2023! See easy money when you know how ;) Yes most of the move is now behind us so whilst I do expect the bull run to continue into April 2024, we are NOT going to get another 700 points! Maybe 200 points to 5000, and then in for a volatile / weak 6 months into late October 2024 before the next 6 month bull cycle kicks in, though in reality as I allude to above, it's more 9 months up and 3 months down, so to fine tune for where the next major cycle top will be between June and August for that drop into October so as to maximise gains whilst positioning to capitalise on the deepest correction of the year, just as we did for 2023 i.e. trim going into the July high to accumulate during Octobers dip.
The final part of this extensive analysis will follow in a few days time that maps out a S&P detailed trend forecast into the rend of 2024.
So for immediate first access to ALL of my analysis and trend forecasts then do consider becoming a Patron by supporting my work for just $5 per month, this is your last chance to lock it in now at $5 before it soon rises to $7 per month for new sign-ups. https://www.patreon.com/Nadeem_Walayat.
Analysis that seeks to replicate the accuracy of 2023:
S&P Stock Market Analysis, Detailed Trend Forecast Jan to Dec 2024
CONTENTS
Investing in the Stock Market is Like Boxing With Mike Tyson
Keep Calm and Carry on Buying Quantum AI Tech Stocks
Synthetic Intelligence
The Roaring AI 2020's
Stock Market 2023 Trend Forecast Review
STOCK MARKET DISCOUNTING EVENTS BIG PICTURE
Major Market lows by Calendar Month
US Exponential Budget Deficit
QE4EVER
US Stock Market Addicted to Deficit Spending
INFLATION and the Stock Market Trend
US Unemployment is a Fake Statistic
S&P Real Earnings Yield
S&P EGF EPS Growth
When WIll the Fed Pivot
Stocks and Inverted Yield Curve
The Bond Trade and Interest Rates
US Dollar Trend 2024
US Recession Already Happened in 2022!
US Presidential Election Cycle and Recessions
Margin Debt
Stock Market Breadth
Stock Market Investor Sentiment
Bitcoin S&P Pattern
SP Long-term Trend Analysis
Dow Annual Percent Change
Stock Market Volatility (VIX)
S&P SEASONAL ANALYSIS
Correlating Seasonal Swings
Presidential Election Cycle Seasonal
Best Time of Year to Invest in Stocks
Formulating a Stock Market Trend Forecast
S&P Stock Market Trend Forecast Jan to Dec 2024
Quantum AI Tech Stocks Portfolio
Primary AI Stocks
AI - Secondary Stocks
TESLA
Latest analysis - Stock Market, Interest Rates, Crypto's and the Inflation Red Pill
Crackup boom + US Dollar black hole that some call the US Dollar Milkshake = Everyone on the planet is buying US assets! After all the US is the worlds sole Empire,

And gain access to my exclusive to patron's only content such as the How to Really Get Rich series.
Change the Way You THINK! How to Really Get RICH - Part 1

Part 2 was HUGE! >
Learn to Use the FORCE! How to Really Get Rich Part 2 of 3

Part 3 Is Huger! And Gets the Job Done! >
Here's what you get access to for just $5 per month -
※ Patrons Get FIRST access to all of my In-depth analysis and high probability Trend Forecasts, usually 2 full months before the rest of the world. Notified by Patreon by email as well as posted on this page and I will also send a short message in case the extensive email does not make it to your inbox.
※Access to my carefully constructed and maintained AI Tech Stocks Portfolio that is updated on an ongoing basis, that includes on going commentary and a comprehensive spreadsheet that features unique innovations such as the remarkably useful EGF's.
※A concise to the point Investing Guide that explains my key strategies and rules
※ Regular content on How to Trade & Invest incorporated into most articles so as to keep patrons eyes on the big picture and net get too sucked into the noise of price swings.
※ Access to my comprehensive How to Really Get Rich series of articles, clear concise steps that I will seek to update annually and may also eventually form a Patrons only ebook.
※ Access to conclusions from my ongoing market studies from a total of over 200 conducted studies over the decades. updated whenever the market poses a question to be answered. Also enjoy the fruits of R&D into machine learning such as the CI18 Crash indicator that correctly called both the pandemic crash (Feb 2020) and the 2022 bear market (Dec 2021) well before the fact.
※Join our community where I reply to comments and engage with patrons in discussions.
※ I will also keep my Patrons informed of what I am currently working on each month.
※ Influence over my analysis schedule.
My objective is to provide on average 2 pieces of in-depth analysis per month and regular interim pieces of analysis as market briefs. So over a 12 month period expect to receive at least 24 pieces of in-depth analysis. Though my focus is on providing quality over quantity as you can see from the extent and depth of my analysis which I deem necessary so as to arrive at that which is the most probable market outcome.
So for immediate access to all my analysis and trend forecasts do consider becoming a Patron by supporting my work for just $5 per month. https://www.patreon.com/Nadeem_Walayat lock it in before it rises to $7 per month for new signup's this month, so your last chance!
And ensure you are subscribed to my ALWAYS FREE newsletter for my next in-depth analysis.
Your crypto's Mania invested analyst.
By Nadeem Walayat
Copyright © 2005-2024 Marketoracle.co.uk (Market Oracle Ltd). All rights reserved.
Nadeem Walayat has over 35 years experience of trading derivatives, portfolio management and analysing the financial markets, including one of few who both anticipated and Beat the 1987 Crash. Nadeem's forward looking analysis focuses on UK inflation, economy, interest rates and housing market. He is the author of five ebook's in the The Inflation Mega-Trend and Stocks Stealth Bull Market series that can be downloaded for Free.


 Nadeem is the Editor of The Market Oracle, a FREE Daily Financial Markets Analysis & Forecasting online publication that presents in-depth analysis from over 1000 experienced analysts on a range of views of the probable direction of the financial markets, thus enabling our readers to arrive at an informed opinion on future market direction. http://www.marketoracle.co.uk
Disclaimer: The above is a matter of opinion provided for general information purposes only and is not intended as investment advice. Information and analysis above are derived from sources and utilising methods believed to be reliable, but we cannot accept responsibility for any trading losses you may incur as a result of this analysis. Individuals should consult with their personal financial advisors before engaging in any trading activities.
Nadeem Walayat Archive |
© 2005-2022 http://www.MarketOracle.co.uk - The Market Oracle is a FREE Daily Financial Markets Analysis & Forecasting online publication.