


Silver Outperforming Gold 2-1
Commodities / Gold & Silver 2009 Oct 11, 2009 - 02:09 PM GMTBy: Merv_Burak

 It was gang-busters for the precious metal stocks. Gold rose almost 5% while silver almost doubled that performance. We are into new high territory and the analyst predictions are now all over the place. Predictions are good, performance is even better. Stay tuned.
GOLD LONG TERM
Let’s do a little catch-up summary of where we are from the long or very long term point of view. First, the P&F charts.
My very long term ($25 unit) P&F chart, shown here a few weeks back, provides us with new price projections only rarely. It has given us one this past week. Because they are rare one should not forget about them during on going trading activities. As mentioned in my 11 Sept 2009 analysis once the price hits $1050 (which it did this past week) then we would have a new price projection to the $2050 level. However, before we jump ahead of ourselves there still is that original projection from the 2003 break to the $1075 level. This level was not quite reached this past week and needs to be taken out by the price action before we can dream towards the $2050 level. There was a second projection calculated during that initial 2003 break-out and that was to the $1575 level. So we have a couple of steps on the way to the $2050 price.
As for my normal long term charts and indicators, everything continues to look rosy. The gold price remains well above its positive sloping moving average line and the momentum indicator remains in its positive zone above its positive trigger line. The volume indicator continues to move ever higher into new high territory (where it entered ahead of the price move into new highs) and above its positive trigger line. Nothing here to worry about from the long term perspective. The rating remains BULLISH.
INTERMEDIATE TERM
My intermediate/short term P&F chart shown last week was very close to giving us a bearish break but quickly turned around and headed into new high ground. These lower time period P&F charts give us more frequent and lower value projections. They are accurate but as it is normal for the intermediate and shorter term trends to reverse up and down while on a very long term trajectory they do get reversed before they get met. They also provide us with many more projections than do the very long term charts. From this P&F chart the best I can calculate as an intermediate term projection would be to the $1195 level. There are a couple of earlier projections but this is the best so far.
Projections are only a guide, not a prediction. They are only for reference purposes and should never be used as trading or investing targets. Let the on going market action be your trading or investing guide.
As you can expect after the action this past week all the normal intermediate term charts and indicators are on the positive side. The price is above its positive sloping moving average line and the momentum indicator is in its positive zone above its positive trigger line. The volume indicator is also in a positive mode being above its positive sloping trigger line. From the intermediate term perspective the rating remains BULLISH. For confirmation, the short term moving average line remains above the intermediate term line, as it has remained since mid July.
SHORT TERM
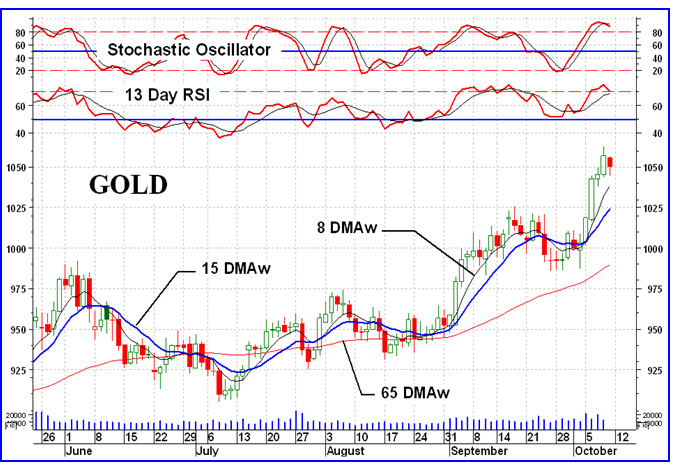
The short term position of the gold price is no secret after last week’s action. What will it do this week is the big question. Just to run down the short term indicators, gold is above its positive sloping moving average line and the momentum indicator is way in its positive zone. In fact the momentum had entered its overbought zone and it looks like it is now reacting lower and just about to break below its overbought line. If it does that we just might see some downside action ahead. It may or may not end up to be anything serious so should that happen we will just have to watch the action and see where it goes. The daily volume action seems to be inconsistent. It is bouncing above and below its 15 day moving average line without any real direction. All in all the short term rating is BULLISH. The very short term moving average line is sharply moving higher above the short term line for confirmation of this rating.
Now, you want to know what happens next. The best indication of any immediate change in trend is to look at the Stochastic Oscillator for a possible clue. Here we see the SO in its overbought zone and already on the decline. It has moved below its trigger line and the trigger has turned downward. The implication, at this time, is for a short lateral period or maybe even a reaction but most likely with the SO still remaining in its positive zone. Any short term reaction might see gold with a support at the $1025 level.
SILVER
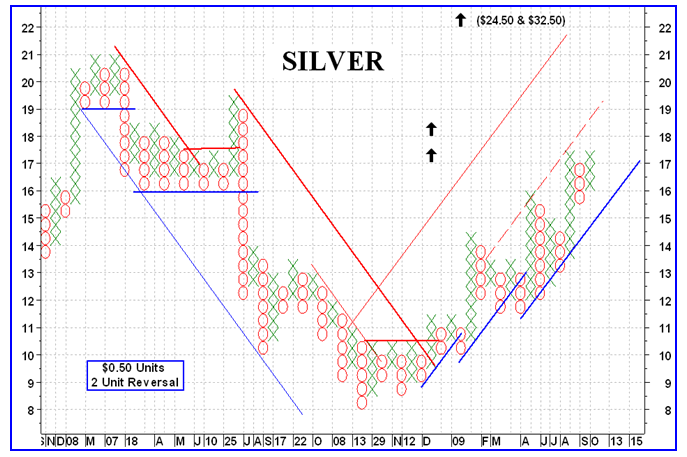
Once more silver appears to be on the March. While gold advanced 4.7% last week silver made it a double by advancing 9.5%. Still, silver is some distance from its previous high while gold is making it into all time highs. Silver’s previous high isn’t even its all time high. That came during the late 70’s and early 80’s (at around $50) when the Hunt brothers tried to corner silver, well they said they weren’t cornering silver but that was their effect. It’s an interesting story and one should read it some times. Just google silver corner and the hunt brothers.
As with gold everything here looks gung ho positive for all three time periods. I said “looks” because there is a warning cloud present. My short and intermediate term momentum indicators have not confirmed the price move into new highs and both appear to be topping out creating a negative divergence versus the price action. This is just too often a precursor to a price downside reaction not to take serious notice of it. I would be inclined not to commit any further capital on the buy side until this warning situation clears itself up. This is more of a time to be sure your exit strategy is operative. The more aggressive speculator might even be starting to check out some short positions, but not to act on them until the turn in price actually starts.
PRECIOUS METAL STOCKS
First, just a quick mention of my Penny Arcade Index (see the Index chart last week). It has moved into new all time high territory exceeding its previous high set in April of 2007 just before its bear market move. It is now up 646% above its Nov 2008 bear market low. This is not a result of one or two heavily weighted stocks performing great. It is the AVERAGE performance of ALL 30 component stocks in the Index. As you can imagine, there are numerous 10 and 20 baggers in the list already. Many more ready to perform. These “pennies”, the real cats and dogs of the industry, continue to move. My view is that as long as these dogs continue to be popular with speculators and gamblers the bull market in the vast majority of quality and secondary stocks is not yet over. There may be stumbling periods along the way but my opinion is that the pennies will provide the advance warning that the rest of the market is moving towards an end. That advance warning is not yet here.
As for the vast universe of gold and silver stocks, this past week was a welcome event especially following a similar week from a month back. Out of the 160 stocks in my weekly universe a full 147 or 92% were on the up side while only 10 or 6% were on the down side. A similar situation exists in all major North American gold Indices. Every gold service should be able to boast of their winners this past week as almost no stock was spared from advancing. All North American Indices advanced anywhere from 10% to 13% this past week except the Merv’s Qual-Gold Index and the S&P/TSX Global Gold Index. Both were adversely affected by the strength in the Canadian dollar versus the U.S. dollar. This had the effect of lowering the prices of Canadian traded gold shares as it took less movement in Canadian stocks to equal a similar move in U.S. stocks. The one Index outside of the 10% to 13% range, on the up side, was Merv’s Spec-Silver Index with a gain of 14.6%. Silver was a big winner this past week and the speculative silver stocks moved. If we took the exchange rate into consideration this was the equivalent of an 18% move in U.S. value.
One cautionary indicator to consider. Most Merv’s and major North American Indices have their momentum indicators showing a potential slight negative divergence. Nothing serious yet but just something to keep an eye out for.
U.S. Dollar Index
The U.S. dollar is trading just above the 76 level and continues to show weakness. It appears to be heading towards a test of its previous 71 low from early 2008. As most traders expect that this weakness in the U.S. $ has a positive impact on the value of gold one should be expecting their actions to then keep the price of gold moving higher. Should the U.S. $ rally then gold should stabilize or move lower. So, watch the actions of the U.S. $ over the coming months. With the U.S. debt not about to get any smaller, can the U.S. $ do anything but go lower?
MERV’S PRECIOUS METALS INDICES TABLE

Well, that’s it for another week.
By Merv Burak, CMT
Hudson Aero/Systems Inc.
Technical Information Group
for Merv's Precious Metals Central
For DAILY Uranium stock commentary and WEEKLY Uranium market update check out my new Technically Uranium with Merv blog at http://techuranium.blogspot.com .
During the day Merv practices his engineering profession as a Consulting Aerospace Engineer. Once the sun goes down and night descends upon the earth Merv dons his other hat as a Chartered Market Technician ( CMT ) and tries to decipher what's going on in the securities markets. As an underground surveyor in the gold mines of Canada 's Northwest Territories in his youth, Merv has a soft spot for the gold industry and has developed several Gold Indices reflecting different aspects of the industry. As a basically lazy individual Merv's driving focus is to KEEP IT SIMPLE .
To find out more about Merv's various Gold Indices and component stocks, please visit http://preciousmetalscentral.com . There you will find samples of the Indices and their component stocks plus other publications of interest to gold investors.
Before you invest, Always check your market timing with a Qualified Professional Market Technician
Merv Burak Archive |
© 2005-2022 http://www.MarketOracle.co.uk - The Market Oracle is a FREE Daily Financial Markets Analysis & Forecasting online publication.