


Gold Price Stealthly Creeping Higher Towards New Highs
Commodities / Gold and Silver 2010 Mar 07, 2010 - 04:28 PM GMTBy: Merv_Burak

 Little by little gold is creeping higher. It still has a way to go before new highs are reached but that may only be a matter of time.
“Just the facts, ma’am” as Joe Friday would say. Actually, he apparently never said those exact words, they seem to have come from Stan Freiberg, but that’s another story. You over 70’s would know what I’m talking about.
Limited time this week so I’ll just cut to the chase as best I can.
GOLD : LONG TERM
This past week gold price gave a new P&F bull market signal after a relatively brief stint in the bear area. So, where do we stand as far as the long term P&F chart is concerned?
This new bull signal has a limited projection, only to the $1230 level but enough to trigger further projections along the way. Assuming a straight up move from here we would get a projection to the $1350 level once the price hits $1185. Should the price break into new highs then we would get a further projection to $1440, on its way to our long ago projection of $1575 (or $1600 to round off the number). Of course, should we get some more up and down movement in the chart along the way those projections would increase.
As for the normal trend/momentum (or strength)/volume indicators they continue to show a positive trend. Gold remains above its long term positive sloping moving average line and the momentum indicator remains in its positive zone above its positive sloping trigger line. The volume indicator is still the weak link in these indicators. It is tracking more of a lateral trend and for now remains below its trigger line, although the trigger is still slightly pointing upwards. Putting it all together the long term rating remains BULLISH.
INTERMEDIATE TERM
On the intermediate term almost everything has now turned positive. The price of gold has decisively moved above its moving average line and the line has now turned upwards. The momentum indicator continues in the positive zone and remains above its positive trigger line. Again, about the only weakness is still in the volume indicator. As mentioned above, it is basically moving sideways but here it is above its trigger line while the trigger line remains pointing slightly downwards. Still, when putting the indicators together my rating for the intermediate term gives me a BULLISH rating. This bullish rating is confirmed by the fact that the short term moving average line has now moved above the intermediate term line.
SHORT TERM
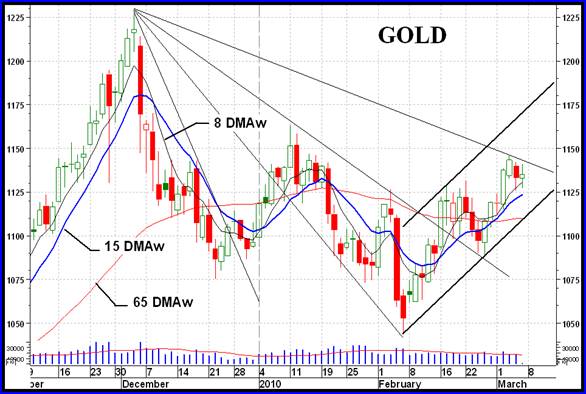
Just a few simple facts shown on the short term chart (or at least MY facts). Shown are two interesting features.
One is my FAN PRINCIPLE trend lines and the other is the up trending channel. Let’s look at the fans first.
Shown is what I refer to as a Bullish Decelerating Fan. It’s bullish because the final outcome is a bull move. It’s decelerating in that the existing down trend is getting weaker and weaker, i.e. decelerating. The FAN trend lines are usually, but not always, relatively equally spaced. My usual criteria is that the breaking of the second FAN trend line indicates an end to the bear trend while the breaking of the third FAN trend line is a confirmation of the new bull trend. What is somewhat unique here is that second trend line. Trend lines are usually drawn from the top of the apex point through the highs of subsequent minor rallies. Once drawn they could, and most often do, become support lines for futures action. After the early year rally we can draw a trend line through the top on Jan 11. This trend line stayed in effect until breached on Feb 16. Now, looking backwards we can draw another trend line that acts as a support line although it does not have a top to go through. We now also have a fourth line. How do we now interpret these lines and the action?
If we assume that second trend line is valid we had a trend end in early Jan with a confirmation on Feb 16. If we assume that second line is not a valid FAN trend line then we have the bear trend ending on Feb 16 with a confirmation now awaiting the breaking of the latest trend line. My own view is the first interpretation. That second trend line, although it does not have a top to draw through has all the other attributes for a FAN trend line, especially acting as a support line with a significant amount of activity trapped between it and the next line.
The other interesting feature of the chart is the up trending channel. The activity to watch here is that the next move, if the channel is valid, would be towards the upper trend line. This would break through that fourth FAN trend line and also above previous resistance from the Jan 11th high.
Back to what’s happening in the indicators. The week’s activity was all above the short term moving average line and the line itself continues to move steadily higher. The momentum indicator is in its positive zone above its positive trigger line. Only the daily volume action is somewhat on the weak side. I’d like to see some higher daily volume action on the upside gold moves. The daily volume still remains basically below its 15 day average volume level. Still, on the short term the rating is BULLISH. This is confirmed by the very short term moving average line remaining above the short term line.
As for the immediate direction of least resistance, I’ll go with the lateral trend here. Although the price remains above its very short term moving average line the Stochastic Oscillator is starting to head lower and is about to break below its overbought line. It has already moved below its trigger line. The direction of the very short term price strength seems therefore to be towards the down side, but it may yet be a few more days for the downside to get going.
SILVER
Silver had a good week and especially as compared to gold’s performance. Having said that silver still has a little more to go to catch up to gold’s recent performance as far as the Relative Strength (RS) ratings are concerned in the Table. I know that almost every commentator is suggesting that silver has a better future than gold but all I can do is go with the actual trading activity in the two. Follow the money, someone said, and the money strength is still slightly towards gold trading when measured in the performance of the commodity price action.
On the long term silver is now above its long term positive sloping moving average line. The momentum indicator is in its positive zone above a positive trigger line. Unfortunately the volume indicator has not yet turned around and remains below a negative trigger line. However, the other indicators were enough to give us a BULLISH rating for the long term.
On the intermediate term silver has now moved above its moving average line and the line has just turned to the up side. The momentum indicator has also moved into its positive zone above its positive trigger line. The volume indicator is still weak but has moved above its trigger line although the trigger is still pointing lower. All in all, the intermediate term rating is now BULLISH. The short term moving average line is still below the intermediate term line and has not confirmed the bull but is moving in that direction.
As for the short term everything is roses. Silver is above its positive moving average line and the momentum is in its positive zone above a positive trigger line. Only the daily volume activity looks weak. However, the short term rating remains BULLISH. The very short term moving average line remains above the short term line for confirmation.
PRECIOUS METAL STOCKS
It was a very good week for gold and silver stocks but not a great week. Over the years I have come to rate a week by how many of the stocks in my universe of 160 (now 190 including the Penny Arcade) made moves of 30% or more during the week. A very good week would have more than 5 stocks with this performance but this week, although most stocks had decent gains, there were none in the 30% or over category. One penny stock came close with a gain of 29.5% but that was it. So, a good week but not a great. We’ll take what we get and be happy, I guess.
Despite not having any 30% plus performers during the week there were 127 (that’s 79%) stocks closing on the up side and only 27 stocks (17%) closing on the down side. With this week’s activity the overall ratings of the universe stocks for all three time periods are now in the BULLISH camp. So, it looks like we are back into a bull market move. It’s early in the move and the most dangerous time for whip-saw moves so one must keep watch for any surprises. This is when we are most likely to get them.
Merv’s Precious Metals Indices Table
Well, that will be it for this week.
By Merv Burak, CMT
Hudson Aero/Systems Inc.
Technical Information Group
for Merv's Precious Metals Central
For DAILY Uranium stock commentary and WEEKLY Uranium market update check out my new Technically Uranium with Merv blog at http://techuranium.blogspot.com .
During the day Merv practices his engineering profession as a Consulting Aerospace Engineer. Once the sun goes down and night descends upon the earth Merv dons his other hat as a Chartered Market Technician ( CMT ) and tries to decipher what's going on in the securities markets. As an underground surveyor in the gold mines of Canada 's Northwest Territories in his youth, Merv has a soft spot for the gold industry and has developed several Gold Indices reflecting different aspects of the industry. As a basically lazy individual Merv's driving focus is to KEEP IT SIMPLE .
To find out more about Merv's various Gold Indices and component stocks, please visit http://preciousmetalscentral.com . There you will find samples of the Indices and their component stocks plus other publications of interest to gold investors.
Before you invest, Always check your market timing with a Qualified Professional Market Technician
Merv Burak Archive |
© 2005-2022 http://www.MarketOracle.co.uk - The Market Oracle is a FREE Daily Financial Markets Analysis & Forecasting online publication.