


What Health Care Plan and A Rising U.S. Dollar Mean For Financial Markets
Stock-Markets / Financial Markets 2010 Mar 22, 2010 - 12:36 PM GMTBy: Mike_Paulenoff

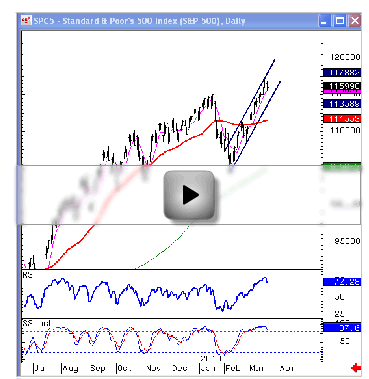
 While the new health care plan could have negative implications for business, for taxes, for the deficit, for interest rates and so on, the S&P 500 has gone straight up since its Feb 5 low. I don’t know what it’s been discounting, but it couldn’t have been discounting the negativity implied by the health care plan. Instead, this rally has to be discounting something positive, whatever that may be.
Perhaps the market is discounting a change in November from a Democratic majority. Or it may be as simple as zero interest rates policies and a lot of liquidity and people being forced into a market where the fundamentals are uncertain and insecure at best and yet as the market goes higher people are forced into it more and more. Perhaps the fundamentals are improving, too. I don’t really know. All I know it that this chart is enormously bullish, and although it deserves a rest, this rest will probably be short-term.
If there is a pullback, the first area of support is 1151 to 1141, roughly, in the S&P 500 cash. If it gets through 1140, I think we could actually go into a real correction down to the 50-day exponential, which is around 1115, and if that breaks it will continue down to the 1080 range. As long as the Feb lows remain intact at 1044, any weakness will be considered a pullback ahead of another up-leg. That’s how I’m looking at a negative reaction to a yes vote on health care – as a pullback that needs to be bought.
This is especially true because the end of the quarter is in eight trading days, and lots of fund managers are under-invested and need to get in and do it before the end of the quarter. So I think that a pullback in the equity market would be cushioned by the desire to buy equities until the end of the quarter. If the equity market opens higher Monday and takes out Thursday or Friday’s highs, then it’s off to the races and I think the S&P 500 goes to 1200 before it pulls back.
Dollar Buying
The risk factors, other than in the equities, this coming week would be in the dollar, which started to lift last Wednesday, Thursday, and Friday and appears to have started a new upleg.
Why would the dollar go up if the negativity of the health care plan is creating selling in equities? It would be going up because of Europe, where it is still unclear how the Greece debt crisis will be resolved.
You can see on the chart that the dollar took off from its rising 50-day exponential moving average. The dollar is in a beautiful rising channel, and looks like it’s headed higher, probably up around 82 1/2 – 83 on the dollar index (DXY).
Looking at the long-term trend, we can see that as the equity market took off in 2009, people became less risk averse. The dollar came down, because in the prior year when there was more risk aversion they were buying dollars for safety. Why would anyone buy dollars for safety, especially when the health care plan makes our finances that much more complicated? Again, it may point to the Europe crisis.
If you look at Fibonacci levels, a 50% retracement for the 2009 dollar decline comes in at 81.90 – 82.00 roughly. I think it can go higher than that. If the dollar opens much lower Monday and takes out last week’s lows at 79.40-50, it could really have problems. However, based on what happened last week, it looks like the opposite will happen and dollar will continue going up.
What does a near-term bullish dollar imply about other markets?
Commodities’ Reaction
It would seem the commodity markets would be the first to have a problem. The PowerShares DB Commodity Index ETF (DBC) still looks like it’s holding by a thread between 23.00 and 24.00.
My sense is that if the dollar continues to go up, commodities will more than likely continue to go down. Historically, dollar strength has implied commodity weakness. However, as the dollar may be rising due not so much a desire to buy dollars but rather than a flight from euros, maybe the commodity sector will hold up and it won’t be a 1-for-1 traditional inverse relationship.
In the DBC, a break of 23.10-.02 would take you down to 22, the next buying opportunity amid a somewhat suspicious uptrend.
The DBC is composed of industrial metals, copper, aluminum , gold, silver and energy. Let’s take a look at some names in the commodity sector.
Starting with Freeport McMoran Copper & Gold Inc. (FCX), the stock has been in a big uptrend since last year. It’s had an enormous run since the Dec low, but it looks to me as though it rolled over last week from a lower high. I think it will seek lower levels at the 200-day exponential level and the major trend line at around 70, which is about a 10% downmove in FCX if things really get moving based on the dollar. A shallower objective would be against the Feb support line, which is at 74. But either way it looks like it could be a victim, so to speak, of dollar strength.
United States Steel Corp (X) also looks like it’s stalled at its prior highs. It got up to 66 and change and recently peaked at 63 and change. It looks like it’s about to pullback towards its 50-day exponential at 55, and below that the major trendline and 200-day moving average is at 45 ½. So here’s another example of a commodity stock that could have a near-term problem – but it’s a pullback that will be bought.
The Market Vectors Coal ETF (KOL) looks very similar to X and it, too, will pull back, but it’s been in a powerful up trend. If it pulls back and breaks its flat 50-day exponential at 36 and change, it will probably go down to 33 and change and that’s where I think the Street will look to buy coal and the coal stocks. That, too, is a commodity sector play that could suffer as a result of a stronger dollar and some sort of correction in equities, which means that the risk-based trades in equities and commodities over the past year or so will be taking a breather.
Newmont Mining Corp (NEM) in the gold sector, too, has been in a powerful up trend. It peaked in Dec, had a pullback, looks like a clear correction down to its moving average. It took it out where it usually does and then reversed, and has now stalled, but it doesn’t look like it’s rolled over in any sense. It still looks like a very strong uptrend. If it pulls back it’s likely to go to below 49 1/2 or so, its prior low, and perhaps 48 1/2. If that breaks, then it could go down to the 45 – 46 area.
Spot Gold has been in a huge uptrend, too -- I’m not sure what the allegiance is to gold these days. It couldn’t be the relationship to the dollar because it is not subject to inversions based on the dollar movement like it has in the past. It’s almost like it’s its own currency and it’s being accumulated on every dip. Having said that, if it breaks 1090 this week then it will probably take the trend line to 1075 – 1076. If that breaks then you’re looking at a retest of the major lows in Feb at 1044. That’s where things could get dicey for gold. A break at that level really tears the technicals to bits, and then there could be a strong decline in gold.
Zero-Interest Bond Market
Finally this week, we look at the iShares Barclay’s 20+ Yr Treasury Bond Fund (TLT), which is the equivalent of the 20 - 30 year bond sector in the treasuries. It is very strange as to how the treasuries have been trading. It looks like the long end of the bond market is trying to build a big base. The recent action in the last two months has seen a minor secondary base being built along with the base from the low of June ’09 that has the potential of creating a W-pattern -- the W being a big double bottom. If the TLT breaks 93.25, they’re going to take off and will have to fill the rest of this base up into the 100 area. That would mean that interest rates will be going down, not up, which in turn would have to mean that the economy isn’t doing so well -- and possibly exacerbated by a delay in spending decisions as businesses evaluate the implications of the health care plan.
View the video chart
Sign up for a free 15-day trial to Mike's ETF & Stock Trading Diary today.
By Mike Paulenoff
Mike Paulenoff is author of MPTrader.com (www.mptrader.com), a real-time diary of his technical analysis and trading alerts on ETFs covering metals, energy, equity indices, currencies, Treasuries, and specific industries and international regions.
© 2002-2010 MPTrader.com, an AdviceTrade publication. All rights reserved. Any publication, distribution, retransmission or reproduction of information or data contained on this Web site without written consent from MPTrader is prohibited. See our disclaimer.
Mike Paulenoff Archive |
© 2005-2022 http://www.MarketOracle.co.uk - The Market Oracle is a FREE Daily Financial Markets Analysis & Forecasting online publication.