


Elliott Wave Analysis of the AMEX Gold BUGS Index
Commodities / Elliott Wave Theory Aug 28, 2007 - 01:15 AM GMTBy: David_Petch

 After publishing the HUI last week, I have had a number of questions about my count. Surprisingly, out of 50 emails received, some 20 were wondering how valid the count was if it was analyzed in semi-log format. Most of the work I do for constructing wave counts are based upon analysis on the weekly charts in semi-log format. The software that I use for displaying the Elliott Wave charts does not have a semi-log function, so I must display them in linear format. With all of the emails, the entire article from last week is presented to hopefully subdue any queries (and my email box) anyone may have.
Glenn Neely is one of the greatest technical analysts of all time and his classic book “Mastering Elliott Wave” should be in everyone's library. Since the 1990 publication of version 2 of his book, he further has expanded his NeoWave with the discovery of diametrics (taking form of a bowtie or a diamond), symmetricals, neutral triangles, and extracting triangles. The following quotation from a 1996 interview Futures article that I consider to be one of “THE MOST” important of all his discoveries: “…the trending wave (1, 3, or 5) that transverses significantly more price than the other two is called the extended wave (price extension); the trending wave that transversed significantly more time…is called the prolonged wave (time extension); the trending wave that possesses significantly more subdivisions…is called the subdivided wave (complexity extension). NeoWave demands that every impulsive pattern possess at least two of the three above rules of Extension. Failure to meet that requirement indicates that the pattern is not impulsive – it is that simple”.
There are many different counts out there that typically might present the impulsive segment of wave I from 2001 until early 2004 as being invalid, but carefully re-read the prior paragraph to memory and think about how it applies to the presented analysis. Following the above rule has prevented me from ruling out this count to date.
One side note: Wave II corrections can be no more than 7-9x the time taken for wave I. Should this correction take “longer than most expect”, the time aspect is virtually guaranteed to remain within the defined time frames of this article.
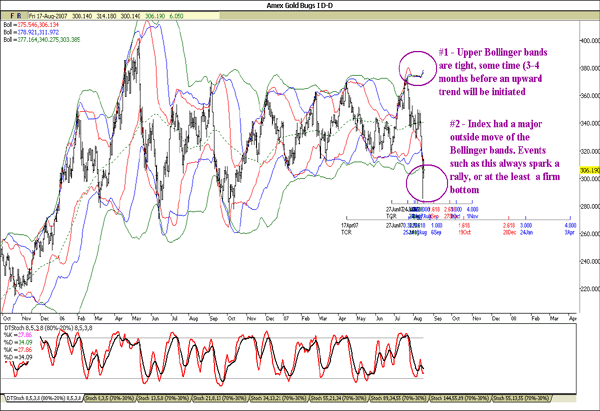
The first chart has some rather interesting observations. In reference to #1, the upper Bollinger bands were in extremely tight proximity prior to the market meltdown and that since the decline would now seek to expand higher. The tightness of the upper BB's at present suggest 3-4 months at a minimum before a final consolidation phase occurs and the HUI FINALLY breaks out of the huge corrective structure as seen below. In reference to #2, the index declined significantly beneath the lower 55 MA; this is very significant because such extremes usually mark the lows of the consolidation pattern developing. As such, it is safe to say that the HUI should remain above the 285-290 level over the course of the next 4-8 months before heading higher. Fibonacci time extensions of different waves are shown mid chart; the noticeable Fib dates that could mark the end of the consolidation underway are late December 2007/early January 2008 or early April 2008. Short-term stochastics have the %K beneath the %D, but it could be turning up based upon the sharp reversal over the past two days. The volatility over the next 4-8 months in the HUI should follow something similar to the Elliott Wave charts presented in Figures 4-6.
Figure 1
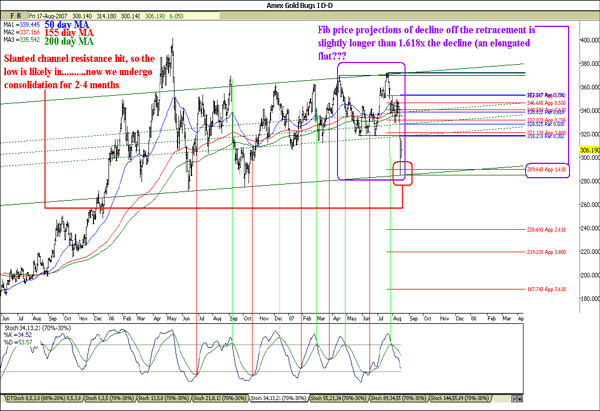
Red lines on the right hand side represent Fibonacci price projections of the top of the wave inside the purple square to the late June low projected off the July top. The move down was slightly greater than 1.618x the initial wave, suggestive this could be an elongated flat of a triangle (if the pattern where to develop (low probability)). This could be part of an alternate count not presented and is extremely complex; so in order to try and keep things as simple as possible, just be aware that a “really complex” alternative count is out there. Blue lines on the right hand side represent Fib price retracements of the June low till the July top. Areas of line overlap between the different Fib lines form Fib clusters, which indicate important support/resistance levels.
The HUI has strong resistance at 318 and 353 and development of a slanted channel, with channel resistance being hit during the decline. Any type of pattern could emerge here, so it is possible the HUI could go back up to 360-365 before declining again. The important thing to note is the HUI likely has 4-8 months of consolidation before going higher. Moving averages are in bullish alignment (50 day MA above the 155 day MA above the 200 day MA), with the 200 day MA acting as resistance at 335. Full stochastics have the %K beneath the %D with no signs of a bottom, so another 1-3 weeks of basing could occur before wave
2.(C).[Y].II starts (see Figures 4-6).
Figure 2
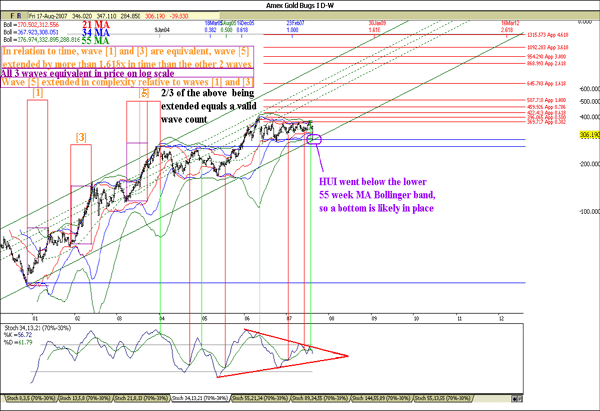
The weekly chart of the HUI is shown below, with Fib time extensions of wave I shown at the top of the chart and Fib price projections of wave I projected off the recent wave II lows. The next Fib date occurs on January 30, 2009 , but if the correction keeps getting pushed further and further out, this date will not have any meaning and a parabolic move ala the alternate count of Figure 6 will occur. To show validity as to why I have held on to the count I have for so long, I have drawn three boxes in pink to represent time (all the same size) and three boxes in purple to represent equality in price. Waves [1] and [3] are equivalent in time (pink boxes), but wave [5] is approximately 145-155% longer than both.
All three waves ([1], [3] and [5]) are all equivalent in price on the log scale…but wave [5] is greater in complexity than the other two waves (there could be some debate on this point). As such, 2/3 of one wave was extended in time and complexity (not price), thereby validating the count. The Bollinger bands are tight, but will continue to become tighter over the coming 4-8 months until the volatility has no where to go but a definitive breakout. The HUI went below the lower 55 week MA Bollinger band, suggestive that we likely have seen the lows for the consolidation over the next 4-8 months. The HUI is likely to remain in a “trading environment” over the course of the next while, so accumulate core positions with only money that one can afford to invest. Full stochastics have the %K beneath the %D within the confines of a stochastic channel. As the chart shows, it is within the realm of probabilities that the HUI remain range bound between 284-370 over the course of the next 4-8 months. The chart is shown in semi-log format to capture the potential move that lies ahead (4-5 years).
Figure 3
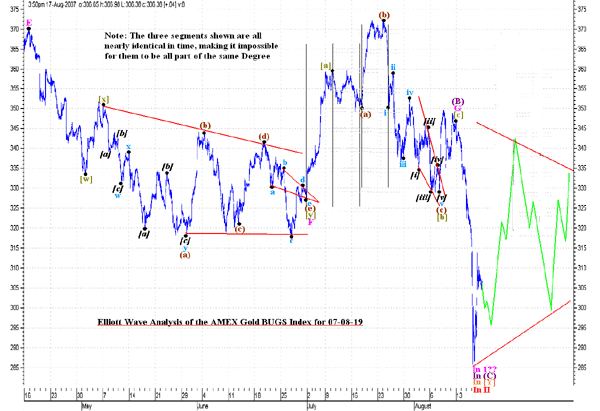
Although Elliott Wave analysis is supposed to be a roadmap of market psychology and predict how future market behaviour develops, huge events such as the market meltdown spurred by the derivative blowout can alter the short-term picture. When events such as this occur, it may alter the short-term wave count, but the longer-term picture should remain unchanged. The short-term Elliott Wave chart of the HUI is shown below. As per the observation 3 weeks ago, three segments of a wave identical in time can not be of the same Degree, thereby requiring “piecing together” of the patterns to give a logical count.
Figures 5 and 6 will show exactly how the wave count has changed on the larger Degree, but the current count has wave G being a flat (3-3-5), with wave [b] having an internal flat pattern and wave [c] failing to retrace all of wave [b], classifying the pattern as a weak flat. This represented the end of wave (B) of a larger Degree flat pattern, with wave (C ) currently forming. Wave (C ) is likely to take the shape of a terminal impulse pattern, with the green lines representing what I “think will happen”. As a side note, Wave F was a double combination, with the final component being a triangle.
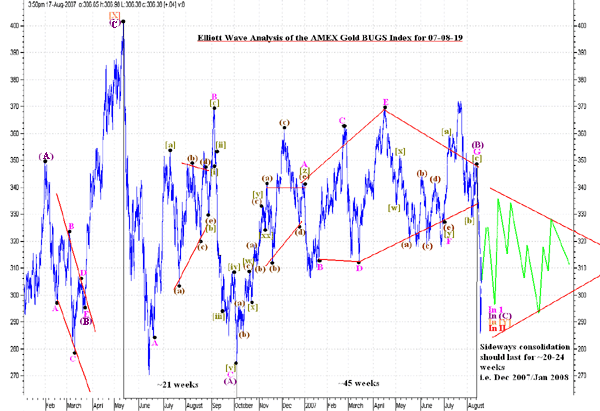
Figure 4
The mid-term Elliott Wave chart of the HUI is shown below, with the thought pattern denoted in green. Due to the pattern I was following being nullified, I had to re-piece the count into something that showed logic to recent market developments. I moved wave [X] higher to represent a zigzag ( 5-3-5 ), with wave [Y] currently forming a flat ( 3-3-5 ); wave (C) of this pattern is likely to form a terminal impulse (3-3-3-3-3) rather than a typical impulse pattern. Wave (A) is a flat pattern, with wave (B) forming a diametric triangle. I have not changed the wave counts very much, except for wave C.(A).
Aside from this, all other patterns simply had the Degree of the count changed or shifted one letter in order to fit the count (all internal counts aside from the above remain unchanged). In Elliott Wave analysis, two waves will either be nearly equal in time to one wave or equivalent by a Fib ratio; wave (A) took ~21 weeks and wave (B) took ~45 weeks, so wave (C) currently underway should take 20-24 weeks i.e. 4-6 months. The HUI could go higher than shown below in green (up to 370), but is likely will remain within the defined trading range of 284-370 before blasting higher.
Figure 5
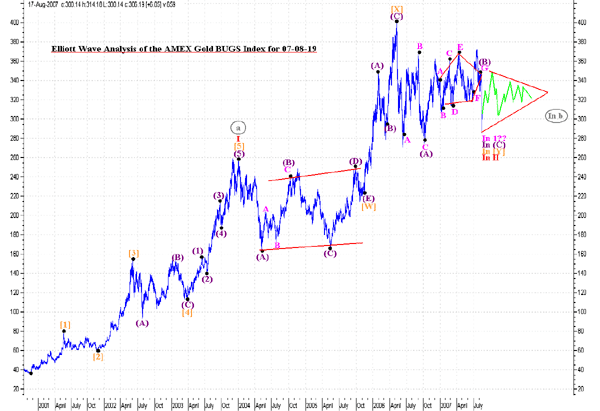
The long-term Elliott Wave chart of the HUI is shown below, with the thought pattern denoted in green. Wave I has three impulsive segments (yes some can be counted many ways, but each one is progressively larger than the prior wave, with alternation between the supposed waves [2] and [4]) with the subsequent move being wave II. If this pattern holds, then the termination point will be higher than wave I, thereby classifying the pattern as a running correction. Running corrections always precede the next longest move in price, time and complexity, which is what we expect for wave III. Wave [W].II was a triangle, with wave [X] being a zigzag. Wave [Y] is taking the form of a flat, with wave (C ).[Y].II currently underway.
The sharp decline of the market created a significant chink in the armour of confidence gold bugs have been wearing as of late, but with time they can slowly be hammered out and polished to make things as before. For this reason expect another 4-8 months of sideways action in the HUI. I would strongly recommend everyone buy bullion on monthly purchases when available, because this will represent the last time that purchases can be made at current prices. A financial advisor should be used for building portfolios and may recommend higher exposure to the energy sector. The alternative count (circled grey) implies that a zigzag is forming, with wave c to follow creating a move parabolic in nature…should the correction extend longer due to suppression.
Figure 6
Because I have focused so much on the HUI the past while for these Internet postings, I will not be publishing any HUI updates external to our site for some time. Today's publication on our site focuses on concepts from this article and expands critical elements, including why some other alternative counts are not valid from a technical standpoint. If anyone has any further technical questions about the HUI, please contact me and I will try to answer. If I do not respond, it is due to being overwhelmed with similar questions.
If the above is an indication of the type of analysis you are looking for, we invite you to visit our newly improved web site and discover more about how our service can help you in not only this regard, but on higher level aid you in achieving your financial goals. For your information, our newly reconstructed site includes such improvements as automated subscriptions, improvements to trend identifying / professionally annotated charts, to the more detailed quote pages exclusively designed for independent investors who like to stay on top of things. Here, in addition to improving our advisory service, our aim is to also provide a resource center, one where you have access to well presented 'key' information concerning the markets we cover.
And if you have any questions, comments, or criticisms regarding the above, please feel free to drop us a line . We very much enjoy hearing from you on these matters, although we may not be able to respond back directly, so please do not be disappointed if this is the case.
By David Petch
http://www.treasurechests.info
Copyright © 2007 treasurechests.info Inc. All rights reserved.
Unless otherwise indicated, all materials on these pages are copyrighted by treasurechests.info Inc. No part of these pages, either text or image may be used for any purpose other than personal use. Therefore, reproduction, modification, storage in a retrieval system or retransmission, in any form or by any means, electronic, mechanical or otherwise, for reasons other than personal use, is strictly prohibited without prior written permission.
Disclaimer: The above is a matter of opinion and is not intended as investment advice. Information and analysis above are derived from sources and utilizing methods believed reliable, but we cannot accept responsibility for any trading losses you may incur as a result of this analysis. Comments within the text should not be construed as specific recommendations to buy or sell securities. Individuals should consult with their broker and personal financial advisors before engaging in any trading activities as we are not registered brokers or advisors. Certain statements included herein may constitute "forward-looking statements" with the meaning of certain securities legislative measures. Such forward-looking statements involve known and unknown risks, uncertainties and other factors that may cause the actual results, performance or achievements of the above mentioned companies, and / or industry results, to be materially different from any future results, performance or achievements expressed or implied by such forward-looking statements. Do your own due diligence.
David Petch Archive |
© 2005-2022 http://www.MarketOracle.co.uk - The Market Oracle is a FREE Daily Financial Markets Analysis & Forecasting online publication.