


Copper and Canaries, Signs of Panic Brewing in World Financial Markets
Stock-Markets / Financial Markets 2010 May 25, 2010 - 02:45 AM GMTBy: Brian_Bloom

 The evidence suggests that the world’s markets may be on the edge of panic.
In particular, the ratio of the gold price/commodities index is manifesting a chart pattern known as a “double top”. Based on historical experience with this type of formation it is very likely that, if the old top is breached, we will see the gold price shooting up relative to commodity prices which, in turn, will likely be falling.&
If this situation does manifest then it will likely be a symptom of a serious shift in market sentiment. Specifically, because of the current confluence of other indicators in other markets, it will probably be representative of a flight to “ultimate” safety. That is, it will likely be accompanied by panic across other markets.
The copper price may well be the canary in the coal mine. The patterns that are manifesting on that chart show a short term oversold position following two significant sell signals. The “non-confirmation” on the oscillator of the daily chart indicates that those sell signals need to be taken seriously.
Fundamentally, if the copper price breaks down, this will negate the positive message being given by the Baltic Dry Index Chart. Whilst the Baltic Dry Index shows that the level of business being conducted in the immediate past has been rising, a falling copper price will be indicative of a market that is expecting the tempo of economic activity across the planet to contract.
Why this change in sentiment will manifest (i.e. what will be the catalyst of this change in sentiment) is anyone’s guess. It might be the European financial crisis or it might be the outbreak of war in Korea. Or it might be something else that is not yet on the radar screens. Identifying the actual catalyst in advance is not only impossible, it is not particularly relevant. Right now, the messages on the charts are converging and this convergence is pointing the possibility of panic in the markets.
*************
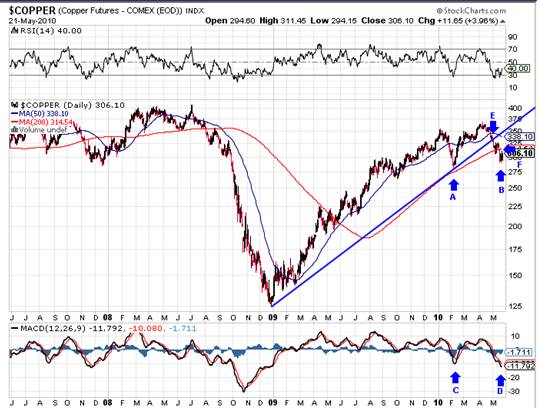
The chart below – courtesy stock charts – is of the daily copper price.
The blue arrows show various sell signals and/or confirmations.
- A-B shows rising bottoms in the price chart
- C-D shops falling bottoms on the MACD oscillator. This phenomenon is known in technical analysis as a “non confirmation”
- E represents a sell signal that was given when the copper price broke below its 50 day MA and then subsequently, below its rising trend line a few days later.
- F represents yet another sell signal as the price fell below its 200 day MA
The copper price is now oversold and “may” experience a technical upward reaction as the price consolidates. But if we look at the behaviour of RSI oscillator between August and November in 2008, this technical upward reaction in price may not materialize.
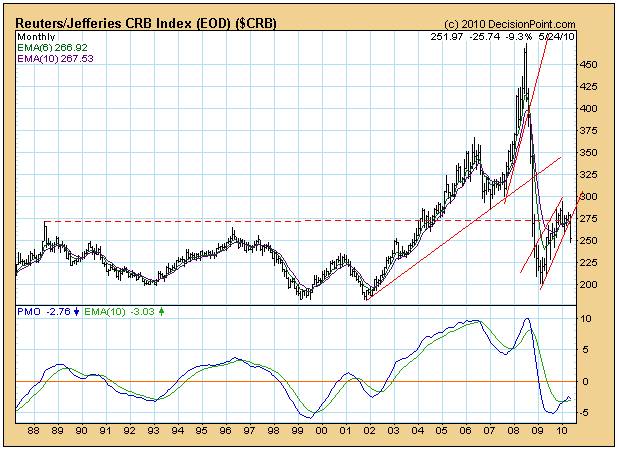
The next chart – of the $CRB (Reuters commodities index, courtesy DecisionPoint.com) – is a monthly chart and the breakdown of this index in the past month is stark. Importantly, it manifested following a technical “buy” signal that had “seemingly” been given a couple of months earlier and highlights the dangers of blindly following such buy and sell signals.
The next chart is of the Baltic Dry Index, courtesy http://www.bloomberg.com/apps/cbuilder?ticker1=BDIY%3AIND
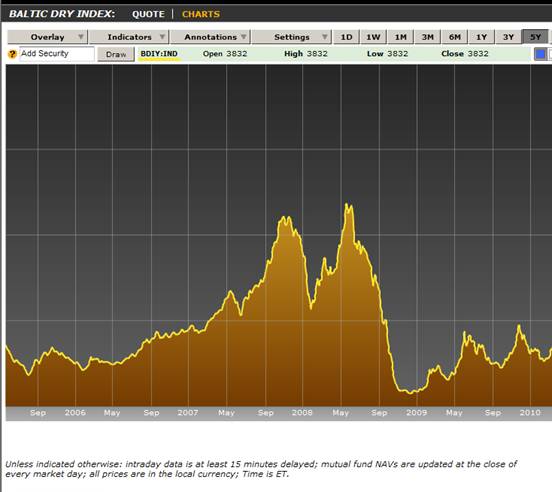
The breakdown in the commodity indices is not (yet) being mirrored in the Baltic Dry Index – which measures the current level of shipping activity in dry goods. This particular index, in this analyst’s view, will be a particularly important one to watch. It dos not monitor what investors “think” might happen in the future. Rather, it monitors actual activity.
The thoughts that have been occupying this analyst’s mind (apart from day to day living) are as follows:
- We have recently seen a Dow Theory Sell Signal. In context of a market that is fundamentally overvalued, this is an ominous sign following the trillions of dollars of stimulus money that has been spent by governments across the world.
- Commodity Indices appear to be mirroring the anticipation of coming deflationary times
- There has been increasing reference in the media to North Korea and a brewing conflict in that region. The latest article was in today’s Drudge Report, which can be seen at http://www.msnbc.msn.com/id/37309788/ns/world_news-asiapacific/
On balance, these thoughts are not comfortable and, theoretically, should be reflected in a rising gold price.
The following is a chart of the gold price:
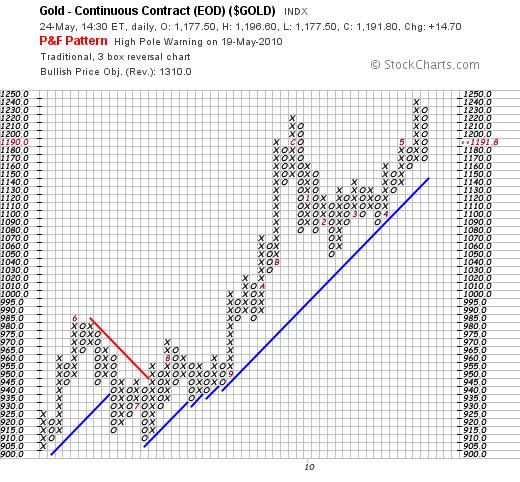
The pattern on this chart is, to put things bluntly, highly suspicious. In brief, there was a breakout to a new high about ten days ago followed by a pullback which gave rise to a “high pole” warning.
This kind of Point & Figure chart behaviour manifests when there has been “concerted” selling following “concerted” buying and the question arises: In context of the Primary Trend sell signal in terms of Dow Theory and in context of the falling commodities, what caused this concerted selling pressure in gold? At this stage the evidence is circumstantial, but we need to keep an eagle eye on things. If gold is a “commodity” then the reason for the fall is understandable. (The price was falling because of sell signals being given in other commodities). However, if gold is a “safe haven” then that selling activity might have been contrived. The charts will eventually reveal their secrets.
But there is one way of checking. We can objectively examine whether the markets are viewing gold as a commodity or as a safe haven. The chart below (also courtesy stockcharts.com) is of the gold price divided by the Commodities Index.
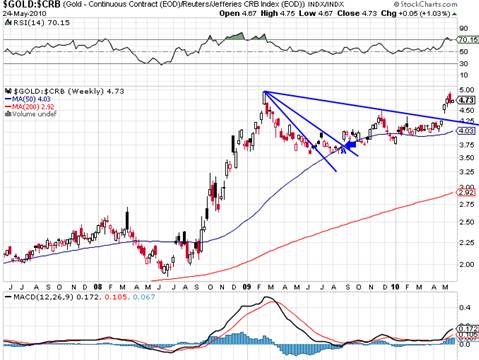
Note the upside gap that manifested at the 4.25 level four weeks ago. More importantly, note that it occurred at a point where the ratio broke up above its falling trend line. Perhaps even more importantly, whilst the last time this happened was at point A, and that gap was “covered” as the ratio subsequently pulled back, this particular gap was to a level above the third trend line of a three line fan formation. In technical analysis, such an event must be regarded as highly significant. In short, there is a strong possibility that this breakout was a “breakaway” gap. If it was, then it very possible that this breakaway gap will e followed by what is known as a “runaway” gap that will manifest as the ratio jumps above the double top level. Breakaway gaps and runaway gaps are typically not covered for a long time, if at all. The reason for this is that they manifest when there is a sudden sea change in sentiment – in this particular case, the sea change will likely be accompanied by fear (panic) as opposed to optimism
Conclusion
Despite evidence that the world economy has in fact been recovering, the technical evidence now suggests that this recovery may have been merely ephemeral. If – after several trillions of dollars have been “thrown” at the various world markets by governments attempting to stimulate a growth in underlying economic activity – the markets now turn down, this down turn will likely be accompanied by panic. Indeed, the charts are showing strong signs of the possibility of an emerging panic. To put a precise timing on this is not possible. However, based on the weekly charts, it might occur at any time within the next few weeks.
Caveat
Clearly, the combined weight of all the potent world governments will be thrown at the markets in an attempt to prevent this sea change in sentiment. If, under such circumstances, the ratio of the gold price/commodities index fails to break to new heights and pulls back significantly, this will indicate that such actions have been (temporarily) successful.
By Brian Bloom
Once in a while a book comes along that ‘nails’ the issues of our times. Brian Bloom has demonstrated an uncanny ability to predict world events, sometimes even before they are on the media radar. First he predicted the world financial crisis and its timing, then the increasing controversies regarding the causes of climate change. Next will be a dawning understanding that humanity must embrace radically new thought paradigms with regard to energy, or face extinction.
Via the medium of its lighthearted and entertaining storyline, Beyond Neanderthal highlights the common links between Christianity, Judaism, Islam, Hinduism and Taoism and draws attention to an alternative energy source known to the Ancients. How was this common knowledge lost? Have ego and testosterone befuddled our thought processes? The Muslim population is now approaching 1.6 billion across the planet. The clash of civilizations between Judeo-Christians and Muslims is heightening. Is there a peaceful way to diffuse this situation or will ego and testosterone get in the way of that too? Beyond Neanderthal makes the case for a possible way forward on both the energy and the clash of civilizations fronts.
Copies of Beyond Neanderthal may be ordered via www.beyondneanderthal.com or from Amazon
Copyright © 2010 Brian Bloom - All Rights Reserved
Disclaimer: The above is a matter of opinion provided for general information purposes only and is not intended as investment advice. Information and analysis above are derived from sources and utilising methods believed to be reliable, but we cannot accept responsibility for any losses you may incur as a result of this analysis. Individuals should consult with their personal financial advisors.
Brian Bloom Archive |
© 2005-2022 http://www.MarketOracle.co.uk - The Market Oracle is a FREE Daily Financial Markets Analysis & Forecasting online publication.