


Who Can Get Hurt the Most - Longs or Shorts?
Stock-Markets / Financial Markets 2010 Jun 17, 2010 - 02:24 AM GMTBy: Sean_E_Blair

 GOLD - Below the market there are some lows on the Weekly Bar Chart that are rather close together. The arrows point to the lows of the bars where the Sell Stops are. Although it is difficult to predict exactly when these lows will be taken out, I would suggest that there is a high probability of it happening… sometime.
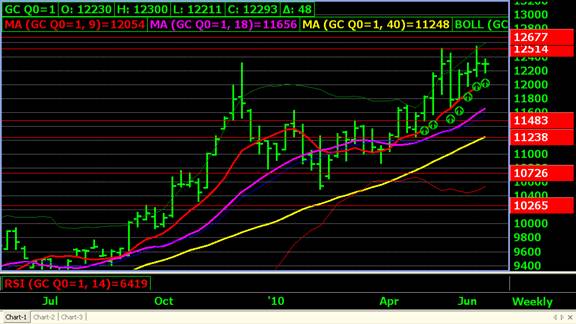
Markets often like to end trends with a blow-off, so a short futures position would be risky right now. Options are most likely the ticket. The only problem is that you ALWAYS need to feel you are putting on an option trade at the precisely correct price/level to ensure consistent success with them. Putting on options “willy-nilly” just because you think a market is going somewhere will cut down on you success rate.
++++>>>
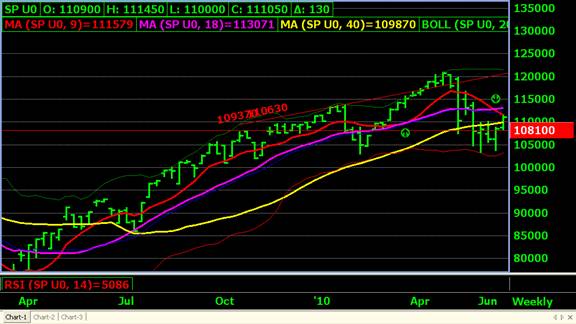
Below is a WEEKLY S&P Chart. For those of you that like to see a fast moving average cross through a slow moving average to determine future direction….. Looks like the “cross” came through last week, and the confirmation seems to show this week. To me, this method of entering positions seems to work about 65% of the time. An example of when it doesn’t work is where the first arrow is pointing. What you might call, a “fake out.”
The good ol’ Upside Down Bear Arm (bullish) is manifesting itself on the 30 min. bar chart below.
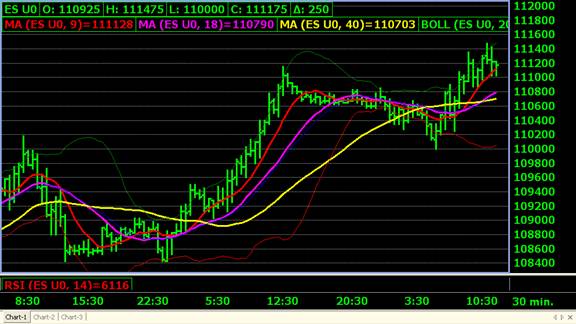
My thoughts are that on an initial break through the 1118.50 area, the SEP S&P will have a (perhaps short term) hard time climbing much higher and correct for an estimated 7 to 10 pts. Aggressive traders might try to sell very shortly thereafter. With a move above 1118.50 and a proper RSI reading of between 75 – 80, I think defensive traders can short with confidence looking for a 7 – 10 pt. drop before we’ll see 1142.75. The greedy soon become the needy, so keep it to a short term trade. Don’t give back your profits.
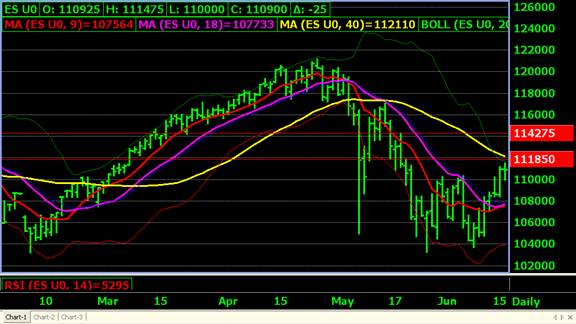
If we make it up above 1142.75 in the next 2 days there’s a significant chance of a nice 20+ pt. pullback for those of you that like to sell to people that chase the mkt.
Sean E. Blair
+FASTMKT>> FOCUS
Adler 747, Inc.
Go Here to Open an Account Online: http://fastmkt.blogspot.com/
2700 W. Pacific Coast Hwy
Newport Beach, CA 92663
Suite 130
FASTMKTFOCUS@gmail.com
Tel. (888) 919- 0444 >>>> 888 - 9190 - 444
Direct. (949) 892- 6442
Anytime. (949) 939- 9814
Fax. (949) 200- 3119
TO ELIMINATE YOUR STRESS AND GET RELIEF NOW, www.ctrlstress.com
***Futures and Options Trading is Risky and Not Suited for Everyone. Trading in Futures and Options should be done with Risk Capital Only, and Should Not Affect Overall Lifestyle should Losses Occur.***
© 2010 Copyright Sean E. Blair - All Rights Reserved
Disclaimer: The above is a matter of opinion provided for general information purposes only and is not intended as investment advice. Information and analysis above are derived from sources and utilising methods believed to be reliable, but we cannot accept responsibility for any losses you may incur as a result of this analysis. Individuals should consult with their personal financial advisors.
© 2005-2022 http://www.MarketOracle.co.uk - The Market Oracle is a FREE Daily Financial Markets Analysis & Forecasting online publication.