


Gold Fails to Break to New All Time High Despite Middle East Crisis
Commodities / Gold and Silver 2011 Feb 27, 2011 - 12:00 PM GMTBy: Merv_Burak

 Despite all the turmoil gold was not able to get into new high territory. It will be interesting which way for gold next week.
GOLD : LONG TERM
Looking at the long term P&F chart we still have not negated that previous bear signal although as mentioned at the time, the bear needed a move to the $1305 level for confirmation, which it did not do before the rally. The two P&F levels to watch would be the previous $1305 level for the bear confirmation or the $1440 level for the bull continuation confirmation. The two levels are some distant apart but that’s the long term for you.
As for the usual indicators, they remain very positive (surprise) with one cautionary indicator. Gold closed the week well above its positive sloping moving average line. The long term momentum indicator remains in its positive zone and above its positive sloping trigger line. However, the actions of this indicator give us reason to be cautious. Although gold almost reached new high levels the momentum indicator has been lagging very badly suggesting much weakness in the strength of the gold price move. I’m almost afraid that if things turn around it might get nasty. The volume indicator remains quite positive, however, so maybe we need not worry but that’s only a maybe. For now the long term rating remains BULLISH.
INTERMEDIATE TERM
With the action over the past few weeks the intermediate term is once more smiles. Gold is above its positive sloping moving average line. The intermediate term momentum indicator remains in its positive zone above its positive trigger line. Here, as in the long term, the indicator is showing weakness in its move. It barely reached the level of strength that gold had during its reactions periods during the Oct to Dec lows, and those levels were during down periods, not during a rally high. So, we need to be on the watch for a reaction in the price and as mentioned above, any reaction just might get nasty (I hope not but who knows?). The volume indicator remains overall positive and remains above its intermediate term positive trigger line. All in all the intermediate term rating remains BULLISH. This is confirmed by the short term moving average moving ever higher above the intermediate term average.
SHORT TERM
The short term rally has been on fairly good strength but the emphasis is on short term. The short term momentum indicator has been quite strong moving above the short term peaks of the previous tops but it looks like the move may have exhausted itself. The momentum had entered its overbought zone and has now dropped below the overbought line. This is often an indication that the move may be over, although it may be just a very temporary rest. Much depends upon the actions over the next day or so.
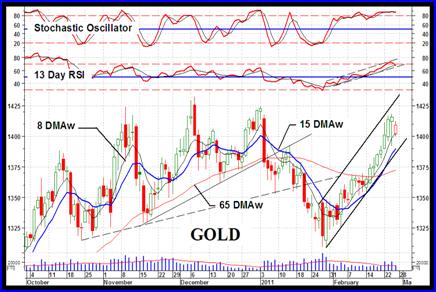
You will notice that I use the 13 day RSI as my short term momentum indicator and different time periods for my intermediate and long term momentum. MOST technicians that use the RSI use this 13 or sometimes 14 day RSI for ALL of their analysis. I’m probably one of the very few that uses a different period RSI for my intermediate and long term analysis. As we see, the short term is very positive while previously I showed that from an intermediate and long term perspective the momentum is very weak. I’ve never been able to justify for myself the use of a short term indicator to gauge the intermediate or long term market perspective but I guess others are able to handle that satisfactorily. So, where are we from the short term perspective?
Well, as you can see on the chart gold remains above its positive sloping moving average line. The short term momentum indicator remains in its positive zone very, very slightly above a positive trigger line but already below its overbought zone and heading lower. The daily volume action continues to be low, which is not encouraging during a bullish rally. I have been criticized (probably fairly) for using only the daily volume as posted by the COMEX trading but I assume that as long as I stay consistent in where I get my data that using some overall global volume from several sources will not give me any better volume information. What I look for is volume variation over time rather than some absolute daily value. After all, these things can be manipulated wherever one gets the information from. For now the short term rating remains BULLISH, confirmed by the very short term moving average line remaining above the short term line. The next day or two will tell us if this rally is really over or not.
As for the immediate direction of least resistance I think that is probably in the process of changing towards the down side but I’ll go with the lateral until better indication. The aggressive Stochastic Oscillator remains stubbornly at a very high level inside its overbought zone but can’t stay there forever. A turn to the down side will most likely suggest a negative market ahead.
SILVER
Although silver continues to out perform gold and has moved decisively into new high ground all of the indicators are basically similar to that mentioned for gold, for the various investment time periods. The major difference in the indicators is in the Stochastic Oscillator. For the silver SO, it has already moved lower and has breached its overbought line to the down side. It has given us a very short term negative divergence in the process and is in much worse shape than the gold SO, but that may change fast if gold should turn lower. For now, as with gold, silver ratings remain BULLISH for all three time periods.
PRECIOUS METAL STOCKS
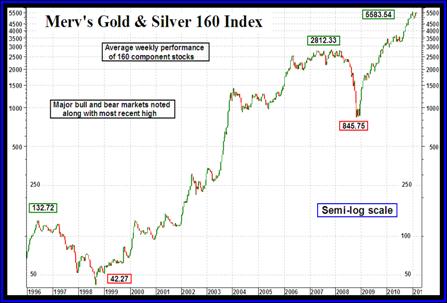
From time to time I show the chart of gold going back to the start of the great bull market but rarely do I show how the AVERAGE gold stock performed during the same period. The Merv’s Gold & Silver 160 Index provides an Index of the AVERAGE weekly performance of the 160 Index component stocks. This Index was first developed in 1993 but I have just shown you the performance during two bull and bear cycles, although the latest bull cycle may not yet be over. The Index includes the top 100 gold and silver stocks traded in the North American markets (based upon market value) plus 60 additional, more speculative stocks.
The two bear markets are interesting in that they declined almost the same amount, -68% in 1996/98 and -70% in 2008. As for the bull moves, the first major bull lasted 9 years and gained an average of 6553% while the second bull move has SO FAR only gained 560% (just for note, the Penny Arcade Index gained 2040% during this same period, since the 2008 lows). The question now is, will it continue to about a 6553% gain to be equal to the previous bull? If so that would be projecting this bull to continue to about the 56000 level, 10 times the latest Index value, that would suggest we are only one third of the way to the next top (from the 2008 low). I am not predicting such move but it is an interesting suggestion.
By comparison, how have the major North American Indices performed during this same period? First, it should be noted that both the PHLX Gold/Silver Sector Index and the AMEX Gold BUGS Index did not bottom out from their initial bear market until late in 2000. By that time the 160 Index had already gained over 100% in value. During the two similar bear market periods the PHLX lost 72% and 66%. During the first bull move the PHLX gained 390% and in the latest move is ahead by 220%. As for the BUGS, it lost 83% and 67% in its two bear moves while gaining 1326% and 245% in the bull moves. It should be noted that these major Indices are calculated whereby the major influence on their value is based primarily upon a few high value (high quality) stocks and most of their Index stocks have little effect on the Index value.
One can make a general conclusion here, first that regardless of the “quality” of the gold or silver stocks they loss just about the same amount during a bear market. However, the lower quality stocks seem to far outperform the high “quality” stocks during a bull market. One might therefore make a general statement that one should speculate in the lower quality stocks during a bull market and get out and relax during a bear market. That’s where technical analysis comes in, timing to get in and timing to get out. The buy and hold strategy just doesn’t work. If one bought the PHLX Index during 1996 they would only be ahead 50% now, after holding for some 15 years. What a performance?
To close this section I just want to suggest that in the future when you hear or read analysts comparing the performance of gold stocks with reference to ANY of the major market Indices, they are not talking about the vast majority of stocks out there but are talking about only a few very large high quality stocks that are the major influence on these Indices. The two may not be the same thing.
Merv’s Precious Metals Indices Table
It should be noted that the Index values for the FTSE Indices are for the period Thursday to Thursday. For some reason my data vendor does not provide the most recent data for these Indices. I would welcome suggestions for obtaining same day Indices values for the FTSE gold Indices.
Well, that’s it for this week. Comments are always welcome and should be addressed to mervburak@gmail.com.
By Merv Burak, CMT
Hudson Aero/Systems Inc.
Technical Information Group
for Merv's Precious Metals Central
For DAILY Uranium stock commentary and WEEKLY Uranium market update check out my new Technically Uranium with Merv blog at http://techuranium.blogspot.com .
During the day Merv practices his engineering profession as a Consulting Aerospace Engineer. Once the sun goes down and night descends upon the earth Merv dons his other hat as a Chartered Market Technician ( CMT ) and tries to decipher what's going on in the securities markets. As an underground surveyor in the gold mines of Canada 's Northwest Territories in his youth, Merv has a soft spot for the gold industry and has developed several Gold Indices reflecting different aspects of the industry. As a basically lazy individual Merv's driving focus is to KEEP IT SIMPLE .
To find out more about Merv's various Gold Indices and component stocks, please visit http://preciousmetalscentral.com . There you will find samples of the Indices and their component stocks plus other publications of interest to gold investors.
Before you invest, Always check your market timing with a Qualified Professional Market Technician
Merv Burak Archive |
© 2005-2022 http://www.MarketOracle.co.uk - The Market Oracle is a FREE Daily Financial Markets Analysis & Forecasting online publication.