


Parabolic Silver
Commodities / Gold and Silver 2011 Apr 25, 2011 - 07:06 PM GMTBy: John_Hampson

 It's the hot topic of the moment, and everyone is offering an opinion, so I'll be succinct. The question I am asking myself is, do I want to take partial profits on silver here?
I don't want to take full profits and get out of the silver market, because, as per my previous analysis, I believe the secular commodities bull has 2 more years to run, silver will see $120 and gold at least $2000. The biggest gains for precious metals will be made in this secular finale. Furthermore, moving to cash is risky given that fiat money is losing value measured in 'real money'. So I want to maintain a long position until I see evidence building for a secular conclusion, but I have to expect that silver will see some jolts to the downside on its way to higher prices. So is a correction imminent?
The Daily Sentiment Index shows 97% bulls, and the daily Relative Strength Index shows a significantly overbought reading of over 90. The PFS intermediate term indicator is at levels consistent with a retreat and silver is heading into a negative seasonality window May-June:
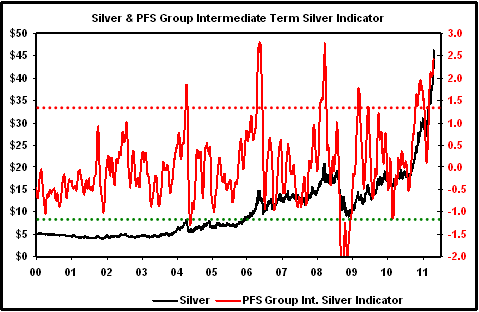
Source: PFS Group
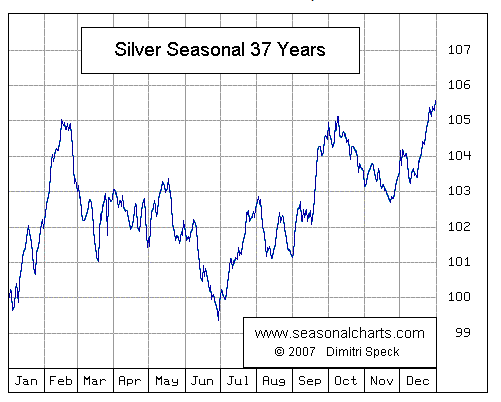
Source: Seasonalcharts.com
If that isn't enough, we all see the parabolic unsustainable chart, and at the time of writing silver is flirting with the 1980 all time high of $50:
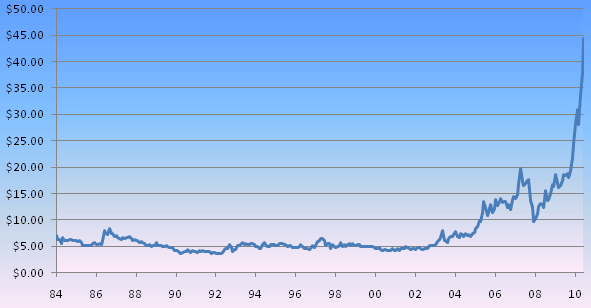
Source: Factset
But parabolic charts conclude one of two ways: either a steep fall down the other side, or a flattening up high to make an S-curve. I previously wrote that the bulk of this steep up-move was just catch up relative to gold. At the time of writing, the gold-silver ratio is around 30, falling between the 100-year average of 40 and the very long historical average of around 16. In keeping with history we should expect silver to extend relative to gold in secular commodities bull finale, so the current reading is not excessive. I therefore believe the S-curve is a distinct possibility, a consolidation at the highs over a seasonally weak period.
Furthermore, gold is not particularly overbought. It has a daily RSI of around 75 currently, but gold previously has not typically peaked until the RSI has reached over 80. Gold has underperformed in the last six months against oil, agri and stocks, so in relative terms shows no exuberance. As silver is a leveraged gold play it is difficult to see silver tumbling unless gold falls too. Gold's technical formation (recent breakout from cup and handle or inverse head and shoulders patterns) suggests this is unlikley. John Townsend's historical analysis suggests that gold may be heading for over $1600 over the next few weeks before any pullback emerges, whilst the US Dollar puts in some exhaustion selling:
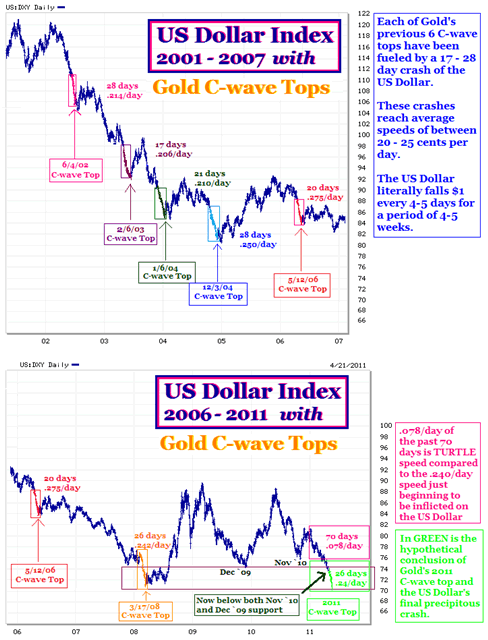
Source: John Townsend, TSI Trader
Revisiting the silver seasonals chart above, weakness has not emerged until mid-May, giving us perhaps another 3 weeks of gains, consistent with JT's gold extension window.
Currently, we do not see negative divergences on silver nor trendline or moving average breakdowns.
So my strategy is this: no silver profit taking - yet. I will be looking for gold to move higher and hit over daily RSI 80 and silver to move higher yet before making negative divergences or technical breaks. I will be looking for this to play out over the next couple of weeks and will then look to take partial profits once these time and indicator measures have fulfilled.
John Hampson
John Hampson, UK / Self-taught full-time trading at the global macro level / Future Studies
www.amalgamator.co.uk / Forecasting By Amalgamation.
© 2011 Copyright John Hampson - All Rights Reserved
Disclaimer: The above is a matter of opinion provided for general information purposes only and is not intended as investment advice. Information and analysis above are derived from sources and utilising methods believed to be reliable, but we cannot accept responsibility for any losses you may incur as a result of this analysis. Individuals should consult with their personal financial advisors.
© 2005-2022 http://www.MarketOracle.co.uk - The Market Oracle is a FREE Daily Financial Markets Analysis & Forecasting online publication.