


The Most Boring Gold Market Ever?
Commodities / Gold and Silver 2012 May 03, 2012 - 01:33 PM GMTBy: Ben_Traynor

 We've just had the quietest 40 days since the financial crisis began...
HOW OFTEN are gold prices as range bound as this?
The London gold fix on Wednesday afternoon marked the fortieth trading day in a row that gold fixed between $1600 and $1700.
The last PM Fix outside this range was on March 5 ($1705 an ounce). Spot gold prices did manage to poke their head above the $1700 mark later that same week, but since then gold has gone pretty much nowhere. Is it common to see such a protracted period of sideways trading?
One way of gauging how much (or indeed how little) gold prices have moved in that time is to calculate the coefficient of variation (CV) – simply the standard deviation divided by the mean average – and compare it with rolling 40 day periods.
The chart below does exactly that, going back to 1968, the year the London Gold Pool collapsed. The vertical green lines represent the final day of any 40 day period with a lower CV than the 40 trading days just gone, with the gold price shown over the top (left hand axis):
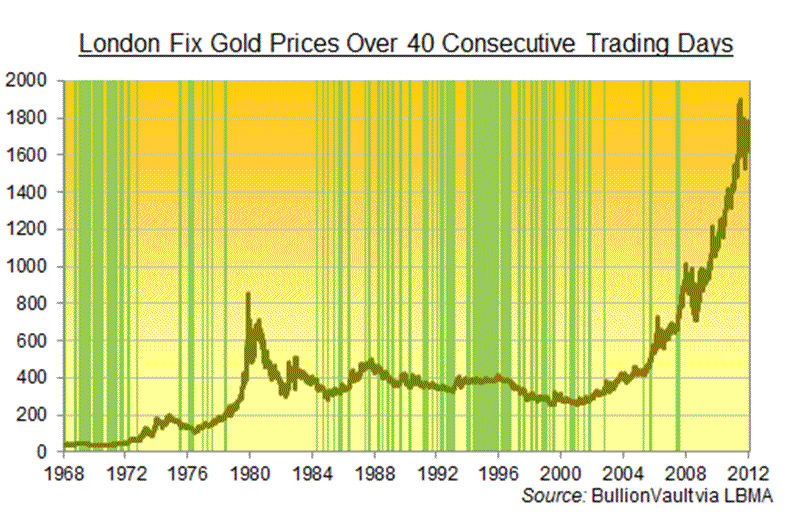
By the CV measure, gold has not had a quieter 40 days since mid-2007, right at the start of the financial crisis.
A block of six trading days – August 30 to September 6, 2007 – each marked the end of quieter 40-day periods than the one we have just had. There is a similar cluster of four days in July 2007.
As you can see from the chart, these days have tended to come in consecutive blocks – which makes sense since we are taking rolling statistical measures. This allows us to pick out specific quiet periods when gold prices were not really doing much.
Over the last 10 years, there have been only five 40-day periods quieter than the one we have just had – the two in 2007, another two in 2005, and one towards the end of 2002.
By contrast, the 1990s saw loads of periods quieter than the current one. So too did the late 1960s and early 1970s, as we would expect since gold was, until August 1971, still officially tied to the Dollar at $35 an ounce (though a two-tier market allowed for a fluctuating price for non-central bank transactions).
Of course, 40 trading days is a rather arbitrary span of time to pick. But similar patterns emerge when we look at other rolling periods.
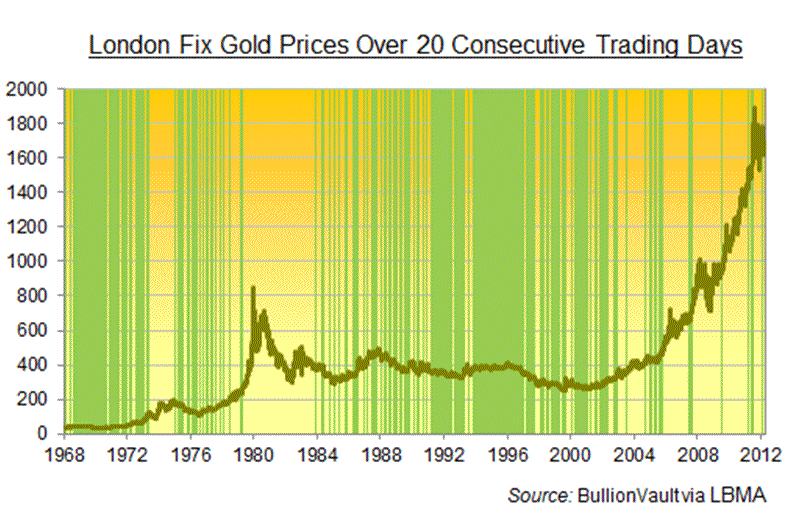
Wednesday 2 May 2012 also marked the quietest 20 trading day period by the CV measure. Here's the chart for rolling 20-day periods going back to 1968:
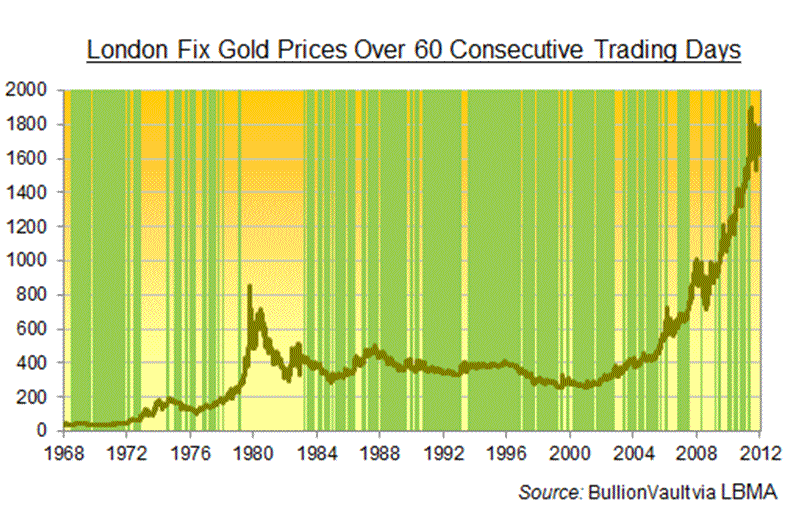
The quietest 60-day period so far this year was actually that ended on April 13. Nonetheless, for ease of comparison, here is the chart showing 60-day periods with lower CVs than the period ended Wednesday this week:
We can draw a few observations from the above:
- Gold prices have rarely been this quiet since the current financial crisis began
- When the last bull market ended in 1980, it didn't end quietly – hence the big gaps between the late 1970s and mid-1980s
- If history repeats, these relatively flat gold prices could be a precursor to the Big Move (as was the case in the mid-1970s), or they could herald a long, slow decline (see mid-to-late 1980s)
Something else happened this week. As my BullionVault colleague Adrian Ash notes, spot market gold prices on Monday ended a calendar month lower for the third month in a row – a rare event indeed in a bull market.
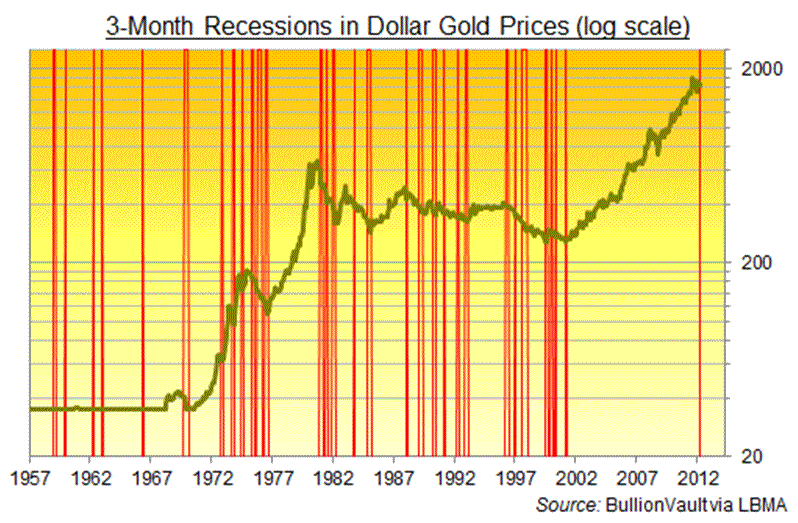
It is also worth checking out Adrian's log scale chart (reproduced below), which shows that gold prices over the last ten years have made a much smaller proportionate gain (shown as the vertical distance moved) than they did in the ten years to 1980:
Putting this all together, both bulls and bears could make a case. The bulls might argue that it is just too quiet for this to be the beginning of a sustained downtrend, and that gold prices are taking a breather before making another move up.
Bears might counter that since this bull market has seen a gentler rise, it may well be followed by a gentler decline, which could be what we are seeing right now.
Ultimately, gold prices over the long run are determined by fundamentals. One of the key fundamentals is real interest rates i.e. nominal rates minus the rate of inflation. And the key central bank to watch is, of course, the Federal Reserve.
There have been signs in recent weeks that the US economy is picking up. This has dampened expectations of further quantitative easing, and has also raised the prospect that the Fed could raise its policy interest rate sooner than previously expected. Few would go so far as to declare the crisis over, but doubts have crept in about how accommodative the Fed will remain.
I believe this uncertainty is the main reason trading volumes have been low, and gold prices have been stuck in a range. It doesn't help that we are headed towards summer, when the gold market tends to be much quieter (2011 notwithstanding).
If the tentative US recovery continues, more investors will likely surmise that QE will not happen, and that a rate hike will be sooner rather than later. On the other hand, if the recovery stalls, QE could shoot back up the agenda.
Sooner or later, gold prices will break out of this range. Whether it will a break higher or a break lower depends a great deal on the health of the US economy.
By Ben Traynor
BullionVault.com
Gold price chart, no delay | Buy gold online at live prices
Editor of Gold News, the analysis and investment research site from world-leading gold ownership service BullionVault, Ben Traynor was formerly editor of the Fleet Street Letter, the UK's longest-running investment letter. A Cambridge economics graduate, he is a professional writer and editor with a specialist interest in monetary economics.(c) BullionVault 2012
Please Note: This article is to inform your thinking, not lead it. Only you can decide the best place for your money, and any decision you make will put your money at risk. Information or data included here may have already been overtaken by events – and must be verified elsewhere – should you choose to act on it.
© 2005-2022 http://www.MarketOracle.co.uk - The Market Oracle is a FREE Daily Financial Markets Analysis & Forecasting online publication.