


Stocks Bull Market Continues
Stock-Markets / Stock Markets 2013 Oct 21, 2013 - 09:47 AM GMTBy: Tony_Caldaro

 After gapping down three of the five trading days, which were mostly bought before 10AM, and two gap up openings, the SPX closed at all time new highs. The DOW ended the week about 300 points from its all time high, and the NDX/NAZ are still a long way from their 2000 all time high. Nevertheless it has been a bull market since March 2009. For the week the SPX/DOW were +1.75%, the NDX/NAZ were +3.45%, and the DJ World index was +2.50%. Economics reports were again sparse, as the government remained partially closed until the last hour “let’s do it again in February” agreement was made midweek. For the week negative reports outpaced positive ones 4 to 3. On the uptick: the monetary base and the M1 multiplier, plus weekly jobless claims were lower. On the downtick: the NY/Philly FED, the NAHB housing index, and the WLEI. Next week, with reporting hopefully back to normal we should get the Payrolls report, Consumer sentiment and some Housing reports. Best to your week!
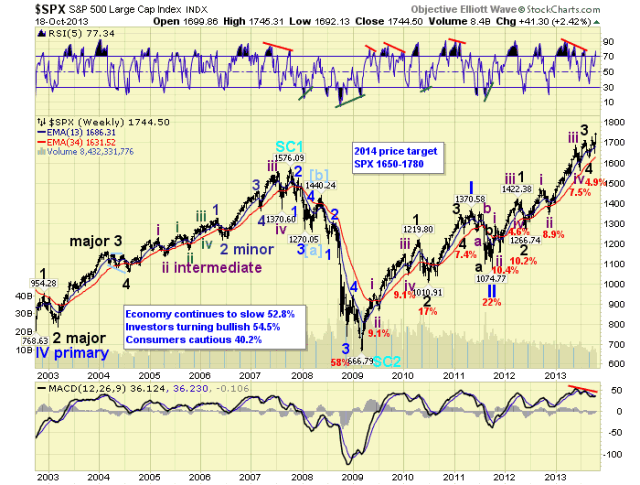
LONG TERM: it is still a bull market
For the past several weeks we have been reporting on a trifurcation between the major indices: NDX rallying, DOW lagging, and SPX caught in the middle. This continued this week, as investors have chased growth while shunning cyclicals. The SPX clearly has both. Last weekend, in an attempt to sort out the current wave count of this bull market we offered three potential counts. They are posted in the Long Term section of that report: http://caldaro.wordpress.com/2013/10/12/weekend-update-418/. After much deliberation, analysis, discussion and observation, we have decided to upgrade one of the counts to most probable while leaving the other two as alternates.
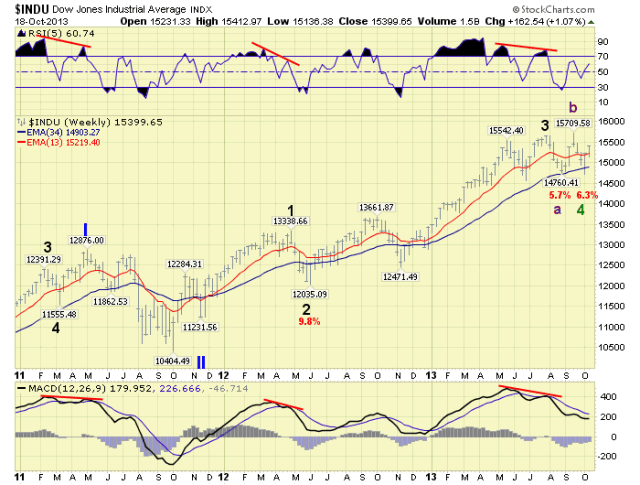
The reasons for this upgrade is that it offers a better perspective of what it going on in the market right now, and it displays wave alternation in the DOW between Major waves 2 and 4. While Major wave 4 in the SPX appears to be simple and quite short. Major wave 4 of Primary I was also simple and quite short compared to its Major wave 2. After the count adjustments the SPX weekly, (and most important), chart remains unchanged. But the daily and hourly charts have been upgraded to reflect the details of that count. This count suggests, both the SPX and DOW are still in Primary III.
MEDIUM TERM: uptrend
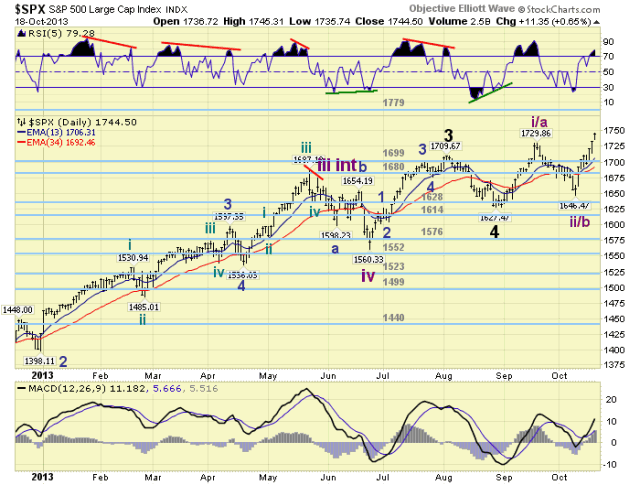
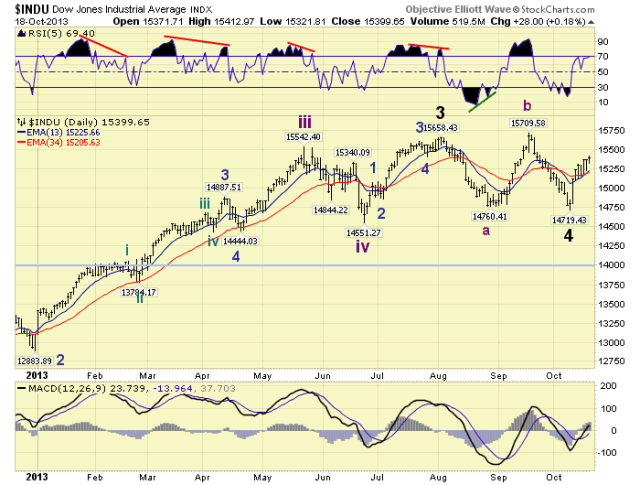
We label the medium term trend UP as the SPX/NDX/NAZ have been uptrending for some time. The DOW, however, has a bit more upside action to go to confirm its uptrend. It is on a slightly different count as previously noted. We maintain the Major wave 3 high at SPX 1710, and Major 4 low at SPX 1627. However, from that point on we are counting this uptrend as either five Intermediate waves I-ii-iii-iv-v, or an ending a-b-c-d-e diagonal triangle. When this rally ends, and wave iv unfolds we should know if it is a 4 or a d wave. Then when this uptrend concludes it should end Major wave 5 and Primary wave III.
The DOW has a much simpler count for its potential uptrend, as Major wave 4 bottomed this month. We are expecting its advance to be a simple one similar to the last two uptrends. When it concludes Major wave 5 and Primary wave III should end here too.
Medium term support is at the 1699 and 1680 pivots, with resistance at the 1779 pivot.
SHORT TERM
Short term support is at SPX 1730 and the 1699 pivot, with resistance at the 1779 pivot. Short term momentum ended the week quite overbought. The short term OEW charts remain positive with the reversal level now SPX 1721.
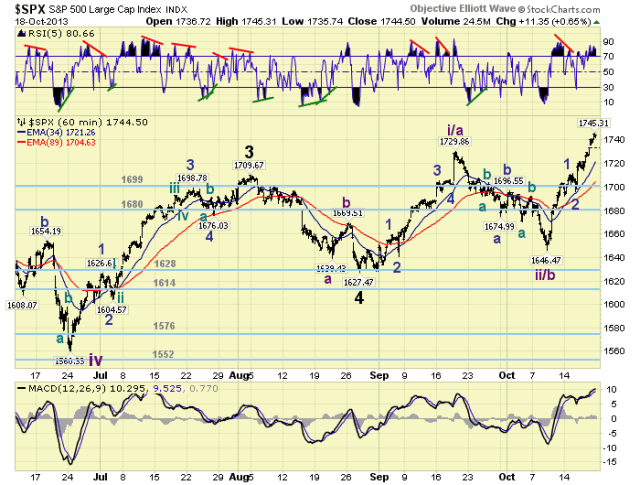
Under this short term count we had a 103 point advance from wave i/a, a steep 84 point decline for wave ii/b, and now a 99 point advance, (thus far), for wave iii/c. With the steep wave ii/b decline the SPX would have to rally quite a bit to avoid overlapping wave i/a during the upcoming wave iv/d decline. Since we have a fairly solid resistance pivot ahead at SPX 1779, thus far, it would suggest a diagonal triangle ending the Major wave 5. Should the SPX clear the seven point pivot range, then the diagonal scenario is not likely to come into play. Keep in mind we are still in a bull market. Best to your trading!
FOREIGN MARKETS
The Asian markets were mostly higher gaining 0.7%.
The European market were all higher gaining 2.5%.
The Commodity equity group were all higher gaining 3.0%
The DJ World index is uptrending and gained 2.5%.
COMMODITIES
Bonds continue to uptrend gaining 0.7% on the week.
Crude remains in a downtrend losing 0.9% on the week.
Gold is trying to establish an uptrend and gained 3.4% on the week.
The USD is still downtrending and lost 1.0% on the week.
NEXT WEEK
Monday: Existing home sales at 10AM. Tuesday: the monthly Payrolls report. Wednesday: Export/Import prices and the FHFA index. Thursday: weekly Jobless claims and New home sales. Friday: Durable goods orders and Consumer sentiment. Nothing on the schedule for the FED this week. Not that they have been reporting anything during the shutdown. Best to your weekend and week!
CHARTS: http://stockcharts.com/public/1269446/tenpp
http://caldaroew.spaces.live.com
After about 40 years of investing in the markets one learns that the markets are constantly changing, not only in price, but in what drives the markets. In the 1960s, the Nifty Fifty were the leaders of the stock market. In the 1970s, stock selection using Technical Analysis was important, as the market stayed with a trading range for the entire decade. In the 1980s, the market finally broke out of it doldrums, as the DOW broke through 1100 in 1982, and launched the greatest bull market on record.
Sharing is an important aspect of a life. Over 100 people have joined our group, from all walks of life, covering twenty three countries across the globe. It's been the most fun I have ever had in the market. Sharing uncommon knowledge, with investors. In hope of aiding them in finding their financial independence.
Copyright © 2013 Tony Caldaro - All Rights Reserved Disclaimer: The above is a matter of opinion provided for general information purposes only and is not intended as investment advice. Information and analysis above are derived from sources and utilising methods believed to be reliable, but we cannot accept responsibility for any losses you may incur as a result of this analysis. Individuals should consult with their personal financial advisors.
Tony Caldaro Archive |
© 2005-2022 http://www.MarketOracle.co.uk - The Market Oracle is a FREE Daily Financial Markets Analysis & Forecasting online publication.