


Stocks Bull Market Continues
Stock-Markets / Stock Markets 2015 Feb 15, 2015 - 05:12 PM GMTBy: Tony_Caldaro

 New all time highs. The week started at SPX 2055, gapped down to open the week, then hit 2042 late Monday afternoon. That was the low for the week. Tuesday the market gapped up, and then made higher highs for the rest of the week culminating with an all time high at SPX 2097. For the week the SPX/DOW gained 1.55%, the NDX/NAZ gained 3.00%, and the DJ World index gained 1.75%. On the economic front reports were not quite as rosy. On the uptick: wholesale/business inventories. On the downtick: retail sales, export/import prices, the WLEI, plus weekly jobless claims and the budget deficit increased. Next week, after the Monday holiday, we get reports on the NY/Philly FED, Housing and Industrial production.
LONG TERM: bull market
The 2009 Cycle wave [1] bull market continues to unfold as labeled. This five Primary wave bull market has only completed Primary waves I and II. When this occurred in 2011 Primary wave III began, and it has been underway ever since. Primary I divided into five Major waves, with a subdividing Major wave 1 and simple Major waves 3 and 5. Primary III appears to be alternating. It has had a simple Major wave 1, a quite extended and subdividing Major 3, and possibly a subdividing Major wave 5 is now underway.
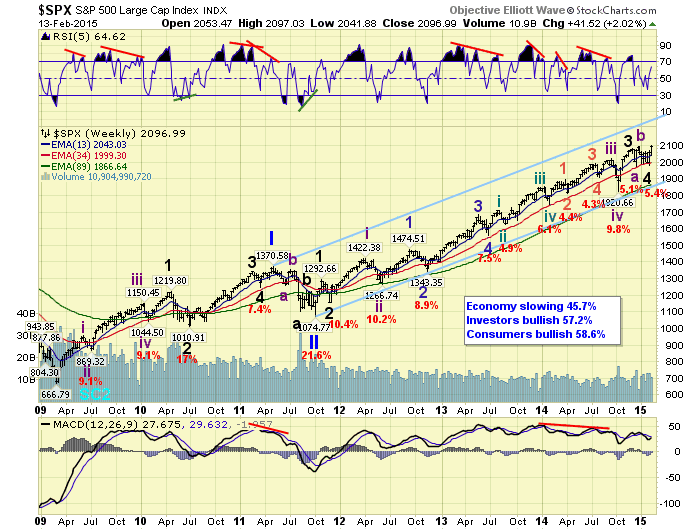
During Primary I the market displayed somewhat of an oddity in its five Major wave pattern. Major wave 1 was longer than both Major waves 3 through 5 combined. Normally, the first wave of any five wave sequence just does enough to kickoff the sequence. Then after a second wave decline, the third wave is the longest and thrust of the advance. Once this occurs, and after a fourth wave decline, the fifth wave can be any length. Primary wave III is displaying exaggerated but more normal characteristics. Major wave 1 did just enough to kick off Primary III. Then after a Major wave 2 correction, Major wave 3 advanced a near perfect Fibonacci 4.236 relationship to Major 1: SPX 2082 v SPX 2079. Also during the five Intermediate waves, that created Major wave 3, Int. wave v was a near perfect match to Int. wave i: SPX 2084 v SPX 2079. And, to our surprise, we have alternation now between the zigzag of Major 2 and the irregular flat of Major 4. Despite these lofty levels, wave patterns are actually starting to normalize.
MEDIUM TERM: uptrend
After making a new high in early-December the market entered a two month trading range which ended on the first trading day of February. We labeled the early-December SPX 2079 high as Major wave 3. Then the correction to SPX 1973 by mid-December Int. A, the uptrend to SPX 2094 in late-December Int. B, and the downtrend to SPX 1981 in early-February Int. C. This completed an irregular failed flat for Major wave 4. From that low the market has rallied 5.9% in less than two weeks to kick off Major wave 5.
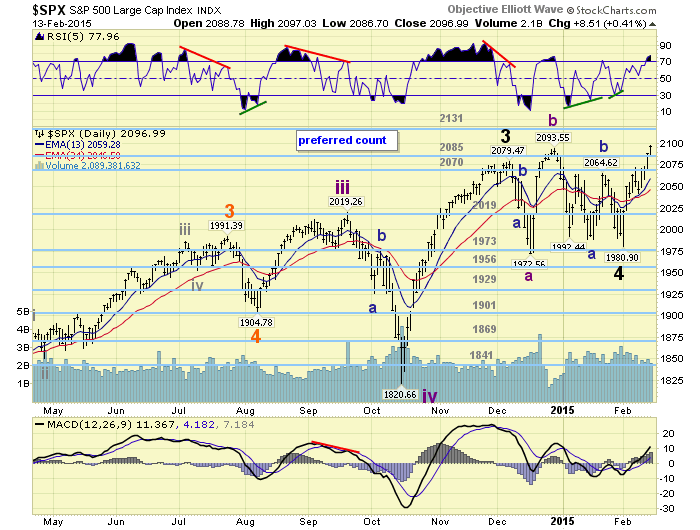
As noted in the previous section: once the third wave is longer than the first, the fifth wave can then be any length. Normally, after an extended third wave, like we observed during Major wave 3. The fifth wave might be equal to the first wave. Should this be the case, the minimum we should expect for Major wave 5 is SPX 2199 (i.e. 1981 + 218). The market closed at its high on Friday: SPX 2097. However, this has not been just any normal market. It has been a market driven by central bank liquidity in an attempt to avoid the deflationary effects of a Saeculum crisis cycle. Or, as most like to call it a deflationary Secular cycle. As a result we are expecting Major wave 5 to advance well beyond the one to one relationship to Major wave 1. However, we are not quite ready to post a potential price/time target until the DOW makes all time new highs. Maybe next weekend. Medium term support is at the 2085 and 2070 pivots, with resistance at the 2131 and 2198 pivots.
SHORT TERM
After the downtrend low at SPX 1981 two weeks ago, we started seeing five wave patterns for the first time since December. We noted the first five wave advance: 2010-1991-2040-2028-2050, and called it a potential uptrend. The market rallied to SPX 2072 that same week, then pulled back to 2055 on Friday. During that advance the market generated a WROC buy signal, also suggesting an uptrend was underway. Then after Monday’s SPX 2041 low the market took off to the upside again in a five wave pattern: 2058-2049-2071-2058-2097. The uptrend was confirmed and new highs were hit on Friday.
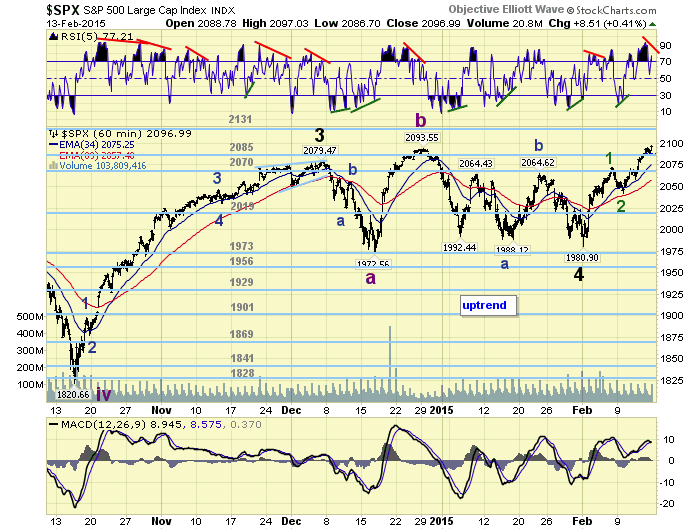
Taking a conservative approach this uptrend may be all of Major wave 5, ending Primary III when it ends. Major wave 1 was only one uptrend too. Therefore, one could count the SPX 2072 high as the first wave, the SPX 2042 low as the second wave, and the current advance as part of wave 3. At SPX 2133 this third wave will equal the first wave, and this is close to our next OEW pivot at 2131. At SPX 2189 this third wave would have a 1.618 relationship to the first wave, which is close to our OEW 2198 pivot. Either way, the two pivots look like a good match for the internal structure of this uptrend.
A more aggressive approach would be to suggest this uptrend is only Intermediate wave i of Major 5. We actually tend to favor this approach for reasons we will explain when we present the price/time targets. Short term support is at SPX 2058 and SPX 2049, with resistance at the 2131 and 2198 pivots. Short term momentum ended the week with a potential negative divergence.
FOREIGN MARKETS
The Asian markets were mostly higher on the week for a net gain of 1.2%.
The European markets were all higher gaining 2.3% on the week.
The Commodity equity group soared to gain 5.5% on the week.
The DJ World index gained 1.75% on the week.
COMMODITIES
Bonds have yet to confirm a downtrend but lost 0.3% on the week.
Crude is trying to confirm an uptrend and gained 0.6% on the week.
Gold remains in a weakening uptrend and lost 0.4% on the week.
The USD maybe rolling over after an eight month uptrend losing 0.6% on the week.
NEXT WEEK
Monday: holiday. Tuesday: the NY FED at 8:30, and the NAHB at 10am. Wednesday: Housing starts, Building permits, the PPI, Industrial production, the FOMC minutes, and a speech from FED governor Powell. Thursday: weekly Jobless claims, the Philly FED, and Leading indicators. Friday: Options expiration. Best to your extended weekend and week!
CHARTS: http://stockcharts.com/public/1269446/tenpp
http://caldaroew.spaces.live.com
After about 40 years of investing in the markets one learns that the markets are constantly changing, not only in price, but in what drives the markets. In the 1960s, the Nifty Fifty were the leaders of the stock market. In the 1970s, stock selection using Technical Analysis was important, as the market stayed with a trading range for the entire decade. In the 1980s, the market finally broke out of it doldrums, as the DOW broke through 1100 in 1982, and launched the greatest bull market on record.
Sharing is an important aspect of a life. Over 100 people have joined our group, from all walks of life, covering twenty three countries across the globe. It's been the most fun I have ever had in the market. Sharing uncommon knowledge, with investors. In hope of aiding them in finding their financial independence.
Copyright © 2014 Tony Caldaro - All Rights Reserved Disclaimer: The above is a matter of opinion provided for general information purposes only and is not intended as investment advice. Information and analysis above are derived from sources and utilising methods believed to be reliable, but we cannot accept responsibility for any losses you may incur as a result of this analysis. Individuals should consult with their personal financial advisors.
Tony Caldaro Archive |
© 2005-2022 http://www.MarketOracle.co.uk - The Market Oracle is a FREE Daily Financial Markets Analysis & Forecasting online publication.